
FlowJo Menus
These are pictures of the main menus in FlowJo for Macintosh. Click on a menu item in the graphics to read about each of the choices in the menu.
Some menu items change when you hold down the option key (click here for more tricks that use the option key.) You can select a menu in FlowJo and press the option key to see the changes in the menu items. Both choices are explained below using a slash... Menu Item/Menu plus Option Key
FlowJo Menu
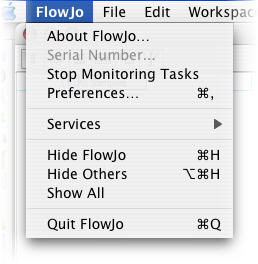
About FlowJo
Contains information about the current version of the program and license protection (serial number or dongle).
Serial Number...
Dialog box showing your Hardware Address and providing a place to enter your serial number. There is a link to TreeStar web pages for registering your hardware address in order to obtain a serial number or to obtain a temporary trial serial number.
Start / Stop Monitoring Tasks
There are many operations involved in creating complex analyses. They are scheduled to take place in the background, and not tie up the computer while you want to work. These monitor windows show you if there is work on the queue, and how much longer it will take. Use this menu item to show or hide the monitor windows.
Preferences...
Set a variety of default program behaviors. Brings up the Preferences dialog window.
Services...General Macintosh services.
Hide FlowJo...
Hides FlowJo windows.
Hide Others...
Hides windows from other open programs.
Show All...
Shows windows from all open programs.
Quit FlowJo...
Quits the program.
File Menu
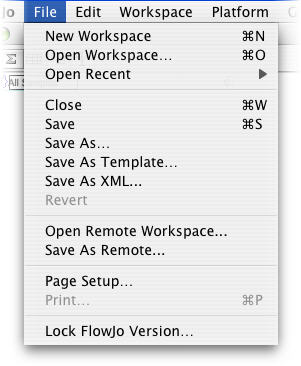
New Workspace
Opens a new, empty workspace.
Open/Recover Workspace...
Open an existing workspace. Use the Macintosh standard file open dialog to select a workspace that you have previously created. In the unlikely event the Workspace won't open, use the the option key to reveal the Recover Workspace command.
Open Recent
Select from a list of the last ten Workspace files you have saved.
Close/Close All Graphs
Close the current window. If you close the workspace window, FlowJo will confirm whether or not to save any changes you have made. If you hold down the option key and a graph window is front-most, then FlowJo will close all open graph windows.
Save
Save the current workspace. If it has never been saved before, FlowJo will prompt you for a filename and directory location.
Save as...
Save the current workspace with a different file name.
Save as Template...
Saves a version of the current workspace with all of the samples removed, so that it is easy to repeat the same analysis simply by adding new samples to the preconfigured template.
Save as XML...
Saves a Workspace in XML format. This will reopen in FlowJo for Mac or PC. Layout information is lost when opening on PC. Must also be moved with the XML file.
Revert
Discard all of the changes you have made to this workspace since saving it and reopen the last-saved version of the workspace.
Open/Recover Remote Workspace...
Enter the URL to download a Workspace file on another computer. Save the URL as a favorite. Option key lets you Recover a remote workspace that doesn't want to open.
Save As Remote...
Give the current Workspace a name and save it to the URL of another computer.
Page Setup...
Define the characteristics of printing you will do from FlowJo, page size, scale, orientation etc..
Print...
Print the current window. See the page on Printing.
Quit
Quit FlowJo. If necessary, FlowJo will ask you to save any changes to current workspaces.
Edit Menu
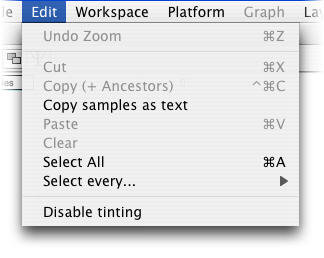
Undo Zoom
Returns Layout Editor to !00% scale size.
Cut
When editing text fields, or working in the layout editor, removes selected text or items and places them on the clipboard.
Copy With/Without Gates
Copy (+ Ancestors)
Used to duplicate items in the layout editor, or to export graphs from a graph window. If the current graph is a histogram, then a second item is also placed on the clipboard: the columnar histogram data in text mode, which you can paste into a spreadsheet. Also see the page on copying graphics to other programs. Gates of subpopulations are included by default, excluded if you press the Option key.
Pressing the Control key will include the graphs of the current population's ancestors. When you paste, all the graphs are pasted. As above you will see Copy (+Ancestors) in the Edit menu.
Copy with gates (Cmd-Option-C)
This is a keyboard variation on the Copy command that also copies the selected population and its child gates to the clipboard.
Copy Samples as Text
This is another variation on the Copy command that uses the clipboard to export a textual description of the selected populations and statistics. Useful for taking the sample list out to a word processor.
Paste
Used to duplicate items in the layout editor, to add text to a layout or when editing text fields. Inserts the contents of the clipboard into the active selection.
Clear
Currently disabled, except when editing text fields.
Select All/ Equivalent Nodes
Select all items in the current window, for example, all samples in the workspace window, all gates in the graph window, or all items in the layout view. With the Option key down, Select Equivalent Nodes selects all data entries that occupy the same place in the gating hierarchy. This way you can quickly select, for example, all of the CD4 gates for all samples. The keyboard command for this type of selection is Option-Command-A. This may be a useful prelude to opening all of those graphs (select them all, then double click on one of them).
Select every....
Selects every other, third, fourth, fifth sample etc. based on the value chosen from the popup menu. This can be useful with regular protocols where, for example, every fourth tube is stained with the same reagent. Being able to select by interval is convenient for dragging several regularly spaced samples to a group.
Disable Tinting
You can choose to have new gates tinted by default in Preferences. Quickly remove the tint on a gate with this menu item. Handy if third party software renders the gates opaque after printing or pasting.
Workspace menu
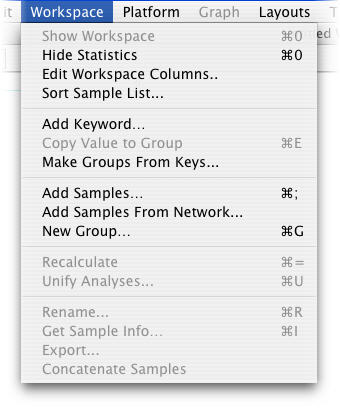
Show Workspace
Brings the workspace window to the front.
Show/Hide Statistics
Hides (or shows) all statistics nodes in the workspace.
Edit Workspace Columns...
Brings up a dialog to change the information displayed in the sample list of the workspace window.
Sort Sample List...
Brings up a dialog that lets you sort the sample list by a variety of keys.
Add Keyword...
Copy Value to Group/Create Value Series
This takes the value in the currently selected field, and applies it to all of the samples in the current group. This is useful for creating keywords with a value shared by all of the members of a group. When you select a keyword and hold down the Option key, you see Create Value Series. A dialog lets you set the initial keyword value, and increment it over subsequent data entries.
Make Groups From Keys... /Groups From All Values
Opens a dialog to choose a keyword as the basis for a new Workspace group. You can give the new group its own color and text style here too. Option key lets you make a group or groups that share a single value of a keyword.
Add Samples / Add Samples Into Group
Add FCS files to the current workspace. Option key lets you select a group and import new samples to it.
Add Samples From Network
Enter a URL and import samples from elsewhere.
New Group... /Put into new Group
Create a new grouping of samples. Brings up the Group Definition dialog. If you first select some samples you want to group then hold down the Option key, Put into new Group creates a group of those samples. The same results from the keyboard command Option-command-G.
Recalculate / Clear & Recalculate
This command asks FlowJo to compute all statistics and frequencies for the populations that are selected. In addition, all descendants of selected populations will also be recalculated. Clear & Recalculate Forces FlowJo to recompute all statistics for all populations, whether or not they have previously been computed. Keyboard equivalent is Option-command-=
Unify Analyses
If you have modified a gate and decide later that it should be identical to the group's version, you can select the gate and choose the Unify Analyses option. Likewise, if you select a group then choose a gated population within it, you can use Unify Analyses to apply this GROUP version of the gate to any samples whose gates have been changed. Learn more about groups.
Rename
Use this command to rename whatever item you have selected in the workspace.
Get Sample Info
Opens a dialog with all the keyword information, compensation matrix, parameters and stains from the .fcs file for a selected sample.
Export...
Export the data from one or more samples and gates as .fcs files or chose to export channel or scale values as an ascii (text) file. Learn more about exporting raw data.
Concatenate Samples
Combines the data from multiple samples into a single sample and saves it to disk as a .fcs file with the name of your choice.
Platform menu
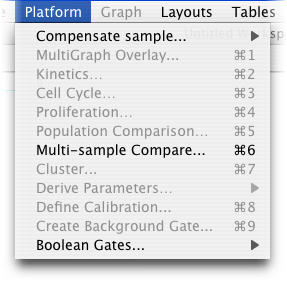
Compensate sample...
Define or apply a compensation matrix. This menu item has a submenu of Compensation processes. If a group is currently selected, then all samples in that group are compensated; if a sample is selected, only that sample is compensated.
MultiGraph Overlay...
Click once in the Workspace window to select the sample you wish to view as a MultiGraph Overlay. Choose MultiGraph Overlay from the Platform menu. Drag and drop a gated subpopulation node from the Workspace menu or draw a new gate within the MultiGraph itself. Each addition to the MultiGraph appears in a contrasting color. More details here.
Kinetics Platform
Launch the Kinetics Platform to perform time-dependent analyses.
Cell Cycle Platform
Launch the Cell Cycle Platform to perform DNA analyses.
Proliferation Platform
Launch the Proliferation platform used in conjunction with cellular markers to study the rate of cell replication.
Population Comparison Platform...
Launch the Population Comparison platform to quantitate and graph the difference between two different population distributions. The comparison utility has options for both univariate and multivariate comparisons.
Multi-sample Compare...
Perform a comparison between two or more different samples, ordering them based on an increasing difference from one sample or a composite of control samples. Creates graphs and statistical displays.
Cluster...
Clustering is the process of automatically identifying within a data collection subsets of events with similar characteristics.
Derive Parameters...
Derive new computed parameters or copy the derived parameters from a sample to other samples. You can only add derived parameters to a single sample; you can only copy derived parameters from a single sample that has them defined. From this menu item you can also delete unwanted derived parameters.
Define Calibration...
Launches the Calibration platform that you can use to convert between the fluorescence intensity collected on your instrument and absolute numbers of fluorophores.
Create Background Gate...
�
Boolean Gates...
Select a parent population, specify subpopulations upon which to apply And - Or - And not - Or not... the gated populations appear in the Workspace list.
Graph menu
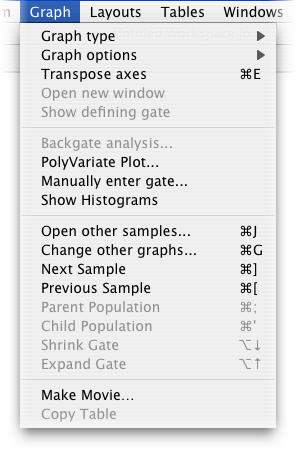
Graph Type
A hierarchical menu, from which you can select one of the following six graph types to apply to the current graph. By holding down the option key you can change all open graphs to the new graph type.
The following are the types you can select:
...Contour Plot
Makes the current graph a probability contour plot. (Holding down Option while selecting this item causes all graphs that are currently open into contour plots).
...Density Plot
Makes the current graph a density plot. (Holding down Option while selecting this item causes all graphs that are currently open into density plot graphs).
...Zebra Plot
Makes the current graph a Zebra plot. (Holding down Option while selecting this item causes all graphs that are currently open into zebra plot graphs).
...Pseudo-color Plot
Makes the current graph a pseudo-color plot. (Holding down Option while selecting this item causes all graphs that are currently open into pseudo-color plot graphs).
...Dot Plot
Makes the current graph a dot plot. (Holding down Option while selecting this item causes all graphs that are currently open into dot plot graphs).
...Histogram
Makes the current graph a histogram of whatever parameter is on the X axis.
...CDF
Makes the current graph a CDF (cumulative display function) of whatever parameter is on the X axis. A CDF is the integral of a histogram.
Graph options
A hierarchical menu, from which you can select one of the following five options to apply to the current graph. By holding down the option key, the type will be changed for all graph windows that are currently open.
The following options can be selected:
...Contour Levels...
For a contour plot, select the frequency of levels that are displayed. A submenu offers several probability settings.
...Smooth
When selected, the appearance of the graph is smoothed. Effects only contour, density, and histogram plots, does not effect underlying data.
...Show Outliers
Draws dots for all events outside of the outermost contour in contour or density plots.
...High Resolution
When on, graph is calculated at higher resolution. Requires more compute time; affects only contour, density, pseudo-color, and histogram plots.
...Invert
Reverse the color of the current plot.
Transpose axes
Switch the X and Y axes of the current plot.
Open new window
Opens a copy of the currently selected graph or if none is selected, a copy of the most recently selected graph.
Show defining gate
When the graph of a subpopulation is selected, this opens a graph window showing the parent population, with the gate that created the subpopulation.
Backgate Analysis...
Displays a series of graphs showing the gating history of a subpopulation that has been gated more than once. The final subpopulation is highlighted in each graph.
PolyVariate Plot...
Opens the controls to create a graph with multiple parameters. By adjusting these controls, subpopulations can be separated visually.
Manually enter gate...
Brings up a dialog allowing you to specify a new gate in terms of channels, absolute fluorescence, or percentile within a distribution.
Show Histograms...
Display a histogram of every channel in the current sample for the events shown in the current plot. This is a MultiGraph Overlay, so you can gate on these graphs or drag subpopulations from the workspace to add to these graphs. Each graph will display each subpopulation in a contrasting color.
Open other samples...
Opens the equivalent graph of the same population for every other sample in the current group. If the windows are already open, then it changes the graph in that window to appear identical to the one you are looking at. If you hold down the option key while selecting this item, FlowJo will not ask you to confirm the operation.
Change other graphs...
Changes every other open graph to look like the one you are examining (i.e., FlowJo attempts to set the axes to the same channels, and the graph type and options identical to the current plot). If you hold down the option key while selecting this item, FlowJo will not ask you to confirm the operation.
Next Sample
Finds the next sample in the workspace sample list which has exactly the same gate as the current graph, and displays it in the current window. By holding down the option key, all open graphs will cycle in this way simultaneously. Same as Right Arrow button in the Graph window.
Previous Sample
Finds the previous sample in the workspace sample list which has exactly the same gate as the current graph, and displays it in the current window. By holding down the option key, all open graphs will cycle in this way simultaneously. Same as Left Arrow button in the Graph window.
Parent Population
When the graph of a subpopulation is selected, this opens a graph window showing the parent population, with the gate that created the subpopulation.
Child Population
Within a graph window with one or more gates, this command opens a graph of the currently selected gate. If more than one gate is selected, the most recently selected is opened.
Shrink Gate
Decreases the area of a selected gate by small increments.
Expand Gate
Increases the area of a selected gate by small increments.
Make Movie...
Turn the current graph into a QuickTime movie, using either time or another parameter to control the display of the current population. See the Movie platform for more information.
Copy Table...
Copies tabulated information from within Cell Cycle and Kinetics platform windows. The table is copied onto the clipboard, from which it can be pasted into any spreadsheet or word processor application.
Layouts menu
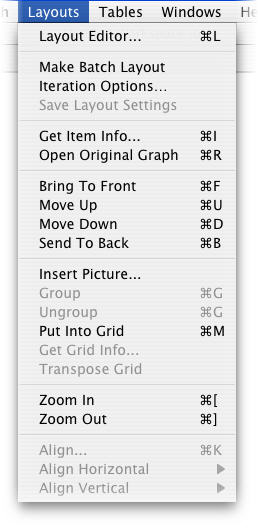
Layout Editor...
Opens the Layout editor.
Make Batch Layout
Takes the current graphic analysis in the Layout editor and reproduces it in the layout based upon each sample in the current group.
Iteration Options.
Brings up the dialog box allowing you to change the iteration variable, to support complex multi-sample reports. More information is available in the Layouts section.
Save Layout Settings/Save Settings as Default
Stores a copy of your layout's tiling settings so that future layouts made with this template will default to the same settings. This command is only enabled for the Print Preview Window.With the Option key down, Save Settings as Default takes the current layout settings and makes them the default used when new layouts are created.
Get Item Info.
Brings up the dialog to edit the attributes of any selected object in the layout. This may be line weights and colors of an arrow or box, or the axes or smoothing algorithm in a graph.
Open Original Graph
With a graph selected in the Layout Editor window, this item opens a Graph window with the same data displayed.
Bring To Front
Operates on the selected object(s) in the layout. Causes it to be drawn on top of other items.
Move Up
Operates on the selected object(s) in the layout. Moves the selected items one step higher in the layer order.
Move Down
Operates on the selected object(s) in the layout. Moves the selected items one step lower in the layer order.
Send To Back
Operates on the selected object(s) in the layout. Moves the selected items to the back of the layer order, causing others to be drawn on top these.
Insert Picture...
Provides a dialog box for you to select a file in PICT format to be displayed in the current layout. Conversion of graphics formats GIF, TIFF, or JPEG requires either QuickTime, Clip2Gif or other plug-in translator.
Group
Multiple objects can be grouped so that they can repositioned, duplicated or deleted all at once. Select two or more items and invoke the Group command and they can be handled as a single object.
Ungroup
Devides a group into individual items again.
Put into Grid / Ungrid
Grids are an advanced form of groups which also determine the positioning and size of objects. As a grid is resized, the spacing and sizing of the elements behaves consistently across all of the cells in the grid. More on grids.
Get Grid Info...
Use Get Grid Info... to adjust the attributes of a grid. If a grid is currently selected, the Get Item Info... command will set the attributes of the contents of the selected cell.
Transpose Grid
The Transpose Grid command changes the number of rows to the number of columns and the number of columns to the number of rows. So a 3 column by 2 row grid becomes a 2 column by 3 row grid. Items are not moved among cells, but if the cell moves, the content moves with it. More at Grids .
Zoom In
Increases the magnification level, so that objects are drawn larger. More controls of the layout's magnification are found in the bottom right corner of the Layout window.
Zoom Out
Decreases the magnification level, so that objects are drawn smaller. Magnification levels range from twice normal size to one eighth of normal size. More controls of the layout's magnification are found in the bottom right corner of the layout window.
Align.
Invokes the custom alignment dialog, which will facilitate building publication quality layouts. The Alignment commands are not enabled unless two or more items are currently selected in the layout. Many alignment and distribution options are available, including the relationship of objects to a grid, and the alignment of the axes of multiple graphs.
Align Horizontal
This item shows the submenu which contains the commands for four different ways of aligning the horizontal component of a set of layout options: by left edge, by right edge, by the center, or such that centers are equidistantly distributed between the leftmost and rightmost objects' current positions.
Align Vertical
Holds the submenu which contains four alignment commands governing the vertical component of a set of layout options: by top edge, by bottom edge, by the vertical center, or such that centers are spaced evenly top to bottom.
Tables Menu
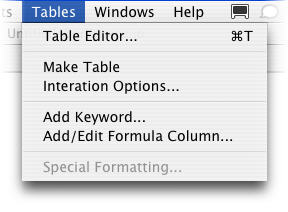
Table Editor...
Define or create a new table of statistics. Brings up the Table Editor dialog window.
Make Table
When you have chosen the contents of a new table in the table editor, this command constructs the table and opens it in a new window
Iteration Options
Opens the Iteration Options Dialog box to specify the group and the common parameter with which a batch will be created.
Add Keyword
This menu item opens a dialog for adding a Keyword to a table. Choose a sample from which to select a keyword. A list of that sample's keywords appears.
Add/Edit Formula Column...
This opens the Create Formula for Table dialog. Defines the terms of a new formula to be applied as a column of values for each population in a table. If a formula is already selected in the Table Editor, this dialog allows you to edit it.
Special Formatting...
Opens the Define Column Attributes dialog. Name or rename a column, select an iteration value, choose special text formatting for values in a chosen range.
Windows Menu
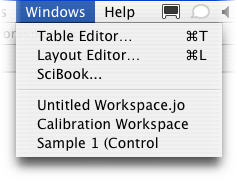
Table Editor...
Define or create a new table of statistics. Brings up the Table Editor dialog window.
Layout Editor...
Define or create a new layout for graphics presentation. Brings up the Layout Editor dialog window
Other Items In the Windows Menu
The names of each of your documents and work windows are added to this menu, each time a new window is created. This can be used as a navigation tool, to be able to bring you back to a desired window, after it has been covered or obscured by other windows.
Help Menu
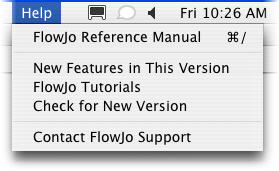
FlowJo Reference Manual
Launches a web browser with the main help pages.
New Features in This Version
Launches a web browser with the list of new features.
FlowJo Tutorials
Launches a web browser with links to download our tutorials.
Check for New Version
Launches a web browser with a link to the latest version download.
Contact FlowJo Support
Launches a web browser with links to the Bug Report Form and our contact details.