
Iteration (Batching)
One of the best things about computers is how they handle repetitive tasks. Show the computer how to do something once, and it will do it a million times without the slightest complaint.
In FlowJo's Layout Editor, you can create a layout based on graphs and statistics from one of your samples. With a single click, you can automatically produce the same layout for each of your samples, or any subset of samples that makes sense for your experiment.
The result of a batch report can be viewed in several different ways. Clicking the Batch button can create:
- A new layout in the layout editor.
- A preview window containing static tiles (data won't update if you change the original analysis.)
- A web page containing the pictures for each layout group, or
- A Quicktime movie.
- Alternatively, it can print the report directly to your printer.
In the simple case, each frame corresponds to one sample in a group. The batch report is made by taking each sample, applying the named gates and statistics to that sample, plotting the graphics in the format defined by the layout editor, and adding that frame to the report. This is useful in cases where the same information is desired for each tube.
Iterating in the Layout Editor
The first thing to be aware of is what is the currently active group in the Workspace window. This will be the selected item in the top half of the window. This is important to know because the current group will determine the set of samples, from which the layout will be constructed.
Next you should look at the popup menu in the layout. In most cases, you'll probably be iterating by sample, and the popup will appear like this:
There are a couple of terms that we use in this explanation that are important to get clear from the start. They are attribute and value. The keywords in an FCS file are organized in attribute-value pairs. The attribute is the name for the type of data recorded. The value is the data recorded for a particular tube. For example, most files will contain, in their header, a $Date attribute, and a value containing the date on which that sample was collected. When we talk about iteration attribute we mean the attribute of the chosen tubes whose value changes in each page of the batch report that is generated.
Changing the Iteration Value
There are several ways to change the iteration value. You can use the popup menu in the layout editor window to show the layout for any value in the current group. Alternately you can use the yellow up and down arrows to move to the previous or next values. From the keyboard, you can use the home, page up, page down and end keys to move to the first, previous, next and last iteration values respectively.
Setting the Iteration Attribute
Other times, reports are created where each frame contains data from more than one tube. Examples of multi-sample reports could be several tissues from a common animal, multiple doses of a common drug, or cross patient studies using blood collected over time. In cases such as these, it is not enough to simply process successive tubes in a batch report. More sophisticated organization is required. Click Layouts > Iteration Options... to set more parameters for your batch operation:
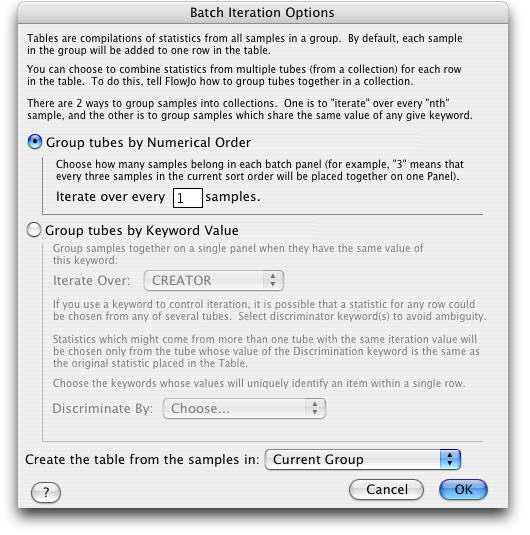
Group tubes by Numerical Order is the easiest method of iterating. If you want to overlay two tubes and batch process the layout so that tube 2 is overlayed on tube 1 and then tube 4 overlays tube 3 etc. choose Iterate over every 2 samples (tubes).
For more complicated iteration, click Group tubes by Keyword Value. The popup menu in this dialog lists all the keywords found in all of the samples of the current group.� Select the keyword that you want in common in all frames of your layout. The value will vary in each of the frames. From the Iterate over... popupmenu, you can select a keyword that groups tubes into distinct units--for example, a keyword that connotes patient ID, tissue type, or experimental condition. Then you can place multiple graphs from different tubes (from different FCS files!) into the same layout and still generate a batch output.
For example, if you set the Iterate over... attribute to be the keyword $Cells, where you have a Patient ID entered into the $Cells keyword, then FlowJo will examine all of the tubes in the current workspace, and generate a list of the unique values of $Cells. These are then displayed in the Layout editor in the Iteration popup menu just below the Batch button. By selecting any of these values from this menu, FlowJo will change the current layout view to show graphs and statistics drawn only from tubes with that value of the Iterator. (By setting this popup menu to Off, you are telling FlowJo to use all of the original graphs that you dragged and dropped into the layout). This is the way in which you can build template reports which select graphs and statistics from different tubes and put them all on the same page, but retain the ability to create a new batch layout drawing from all the data in the Workspace.
Multiple sample Iteration
The Iteration Options also provide the ability to specify one or more discriminator keywords. These fields provide the value that must stay constant, while the iteration attribute changes through each of its successive values. For example, if you have a ten mouse study, and for each mouse you collect three different tissue types, then there would be thirty tubes in the experiment. You want to produce a ten page report, showing the graphs and statistics for each mouse, one per page. You've acquired the data such that the mouse identifier is stored in the FCS file's $SMNO (sample number) field, and the tissue type information is stored in the $CELLS field. Set the field $SMNO to be the iteration attribute, and the keyword $CELLS to be the discriminator.
More than one discriminator can be defined if desired. By selecting additional keywords in the popup menu, the string of discriminators will be extended. To start over, choose the second item in the menu, marked Select None. This empties the list.
The most common case is where the iteration attribute is the sample, by which we generally mean the tube that was run through the cytometer (as opposed to the sample taken from the subject.)
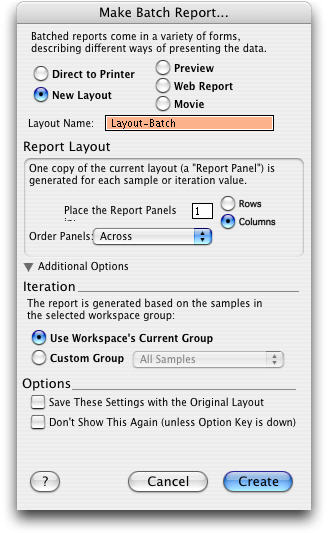
When you click the Batch button you see the Make Batch Report box at the top of this page. The New layout and print Preview reports have placement controls. You can specify the number of rows or columns you want to generate, and whether the new items are arrayed left to right or top to bottom.
Finally, there are three additional options provided at the bottom of this dialog. Iteration lets you choose which group the batch process will iterate through. The option to Save These Settings with the Original Layout, if checked, will store all of the settings in the approved layout. In this way, it is straightforward to replicate this report many times in the future. The option Don't Show This Again (unless Option Key is down) gives you a means to simplify the use of the program and avoid seeing the dialog in the future. If you are always producing the same reports with the same characteristics, this is a way to prevent untrained users from producing the wrong kinds of reports. If this option is not checked, you can still avoid the dialog by holding down the option key when clicking the Batch button.