
Graph Window
The Graph window is the window in which FlowJo displays graphical data: contour plots, histograms, dot plots, etc. From this window, you can draw gates to create subsets of the data and select a variety of different representations of the data. To create this window, double-click on any population node within the sample list in the workspace.
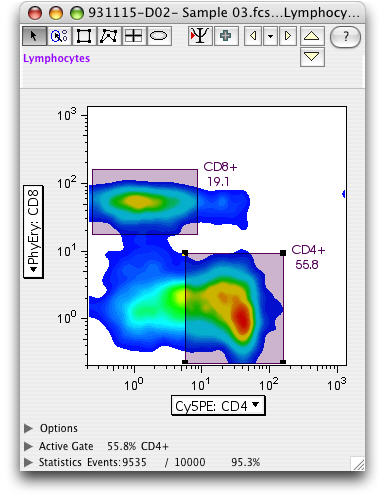
The graph window provides much information about the current subpopulation that it displays: cell counts and frequencies (percentage of total sample), any statistics you have requested, and any gates that were computed on the current population. There are controls to navigate the gating tree, so you can automatically go to the graph display that you used to create this subpopulation; you can also automatically display any gate that is created within this subpopulation.
You can select the default graph type for new samples through the Preferences dialog. You can change any aspect of the graph by selecting the appropriate menu item under the Graph menu; you can also open the Options disclosure triangle at the bottom of the graph window.
All graph windows have controls to switch between the next or previous sample in the workspace window list. (Yellow arrows, upper right.) When you click on one of these controls, the exact same graph for the next sample which has the same subset is shown (this may mean that intervening samples, which don't have the same gates, are skipped). These controls let you quickly cycle between different samples to compare the graphs. If you hold down the option key while clicking on this control, then all open graph windows are cycled to the next (or previous) sample. In this case, the command is applied individually to each window; thus, if different windows are pointing to different samples, then after cycling they will still point to different samples. You can also activate the next/previous command from the Graph menu at the top ofthe monitor.
Select a specific topic for more information:
The following types of graphs can be generated in the graph window:
Bivariate displaysCompare bivariate display types |
Univariate displays |
|
You may also wish to look at the pages on copying graphics to other programs and generating publication-quality graphs.