
Drawing Gates
Gates are the way by which you can specify a subset of the data for further analysis. You can create several kinds of gates in FlowJo. FlowJo represents this new population by creating a new node in the workspace analysis tree. The node is inset below its parent, which designates that the node is a subpopulation of the parent population.
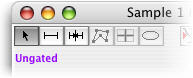
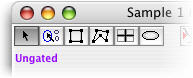
You can create gates by using a gate tools in the graph window. Gate tools are shown at the top of the graph window, and include a range tool for histogram plots (right), as well as 2D tools such as rectangles, polygons, ellipses, and quadrants (below). The selection tool (arrow) is used to select gates before moving them, deleting them, or modifying them. Selected gates are indicated with square black handles.
Depending on how you have set the preferences, FlowJo may automatically select a gating tool when you click in a graph window. If your preference is to have FlowJo automatically select a gating tool, you can choose to have the polygons or rectangles tool as your default for bivariate displays. Note that you can hold down the option key while clicking, to toggle between the rectangle and polygon gating tool. To draw other types of gates, select the appropriate tool.
Once you have created a gate (except when you use the quadrant tool), FlowJo asks you to name it. FlowJo supplies a default name based on the parameters used to draw the gate; you may type in any name you wish. Note that gate names must be different than any other "sibling" of that gate; i.e., a population cannot have two gates with the same name (see information on naming subpopulations).
You can change a gate by moving it or moving one of its vertices; the gate is automatically recomputed as you change it. You can delete a gate by pressing the delete key when a gate is selected.
Note that you can manually enter in the boundaries of a gate if you wish; you can specify the gate boundaries in terms of channel number, absolute fluorescence, or percentile within the subset.
Types of Gating Tools
To draw a gate on a one-dimensional plot (on a histogram or CDF plots), simply point the cursor in the graph window where you wish to have the upper or lower bounds, click on the mouse, and while holding the mouse down, drag to the other extent of the gate. You can click on the line to move it right or left (changing the bounds of the gate), or up or down (which does not change the gate itself). Alternatively, you can move the upper or lower bound to extend the gate.
The other types of gates are drawn on any bivariate plots. A polygon gate with any number of vertices is started by clicking within the graph window. Move the cursor to the next vertex; click to generate another point in the polygon. Holding down the shift key will force the edge of the gate to be horizontal or vertical. You may close the polygon either by clicking on the originating point, or by double-clicking on the next-to-last point. (You can cancel the generation of a polygon by hitting the "esc" key on the keyboard at any time). You can press the "delete" key to erase the last vertex you created for any polygon.
To automatically create a polygon gate that fits your data clusters, use the Autogate feature.
A rectangle gate is started by clicking the rectangle tool (or holding the option key while clicking in the graph window). Move the mouse to create the appropriate sized rectangle. Holding down the shift key will force rectangle to have equal sides (ie, to be a square).
An ellipse gate can be created by selecting the ellipse tool. Ellipses can be rotated by clicking on and moving the left or right handles of the ellipse. The width of the ellipse is changed by moving the top and bottom handles.
Use the quadrant tool to create four non-overlapping rectangular gates. For more information on creating and using quadrant gates, click here.
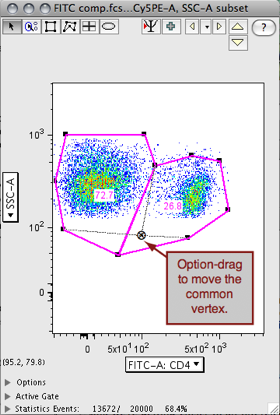
Link Adjacent Gates Together
You can glue adjacent gates together, or more accurately, link their vertices.
- Drag gates together so that their vertices line up.
- Press CMD+Opt+M to join the adjacent vertices
- Opt+click to jointly move the shared vertices
When you deselect the group and select and move an individual gate it, the gates are once again independent.