Cumulative Distribution Function
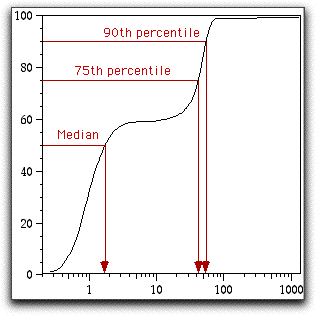
CDF, or Cumulative Distribution Function plots display exactly the same information as do histograms. The difference is that the histogram values are summed as the fluorescence intensity increases; thus, the CDF begins at 0% (left axis) and ends at 100% (right axis). You can change the vertical scaling (to expand a portion of the CDF plot) by setting the appropriate fields in the Graph Specification Dialog (click i on the graph window to show this dialog). CDF plots are extremely useful for quickly finding the fluorescence of a distribution corresponding to any given percentile (such as the median). The sample plot below shows how to find the median (50th percentile), 75th, and 90th percentiles for this data. Note that unlike the histogram, the Y-axis is labeled in units of relative frequency. In this example, the median fluorescence of the population is about 6.0 fluorescence units.

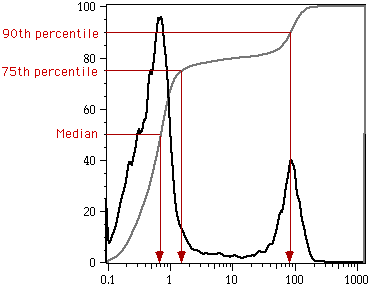
The plot below overlays the CDF and the histogram for the same data. (This overlay was done by copying the graphs from FlowJo into Canvas and overlaying them in that program).

See also the page on histograms.
