Histograms
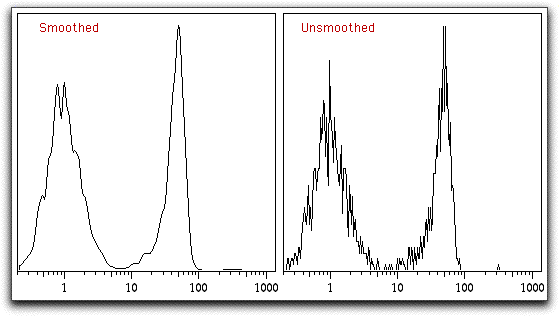
Histograms display a frequency distribution of the data, as a function of fluorescence intensity. The histograms can be smoothed (by default) or unsmoothed; this option has little effect when more than a few thousand events are in the gate. Shown below are the same dataset shown with and without smoothing turned on.
The Y-axis for histograms is the number of cells falling within each "bin" of the histogram; there are 256 bins for each histogram.

You can manually set the lower and upper limits on the Y axis; the default is to have FlowJo determine the optimal limits. To set these limits, use the Graph Specifications Dialog, by opening the Options triangle in the graph window.
When you copy a histogram graph, two items are placed on the clipboard. One is the graphic rendition (such as shown above); the other is a text item containing two columns of text data that represent the histogram (channel numbers & channel counts). When you paste theminto a spreadsheet, you will create the two new columns of the histogram data. (Note: a few graphics programs will preferentially paste a text item (the column data) instead of a graphic item from the clipboard. If you encounter this problem, set the Preference such that FlowJo only copies the graphic item onto the clipboard.)
See also the page on CDF displays.
