
Preferences
There are a number of default behaviors of FlowJo which you can alter. These are modified through the Preferences dialogs, shown below. To get to these dialogs, select Preferences under the Edit menu on OS9 computers or under the FlowJo menu on OSX computers.� Preferences are grouped by topic.� To select a set of preferences, clicking on the appropriate tab at the top of the dialog.
For more information about each type of preference, click on the topic:
Workspace Preferences
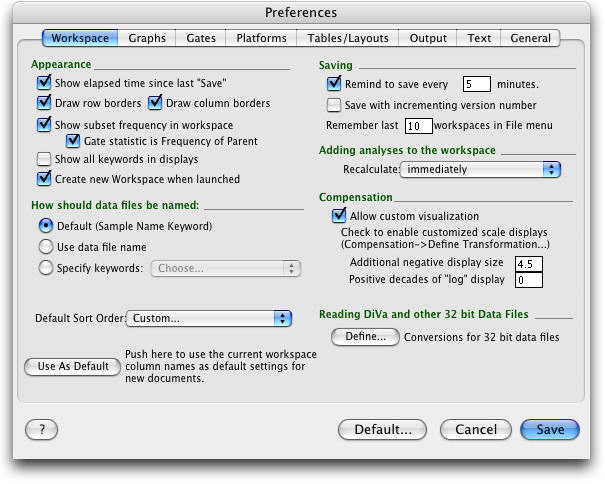
The section marked Appearance defines preferences about the how the workspace appears. You can have FlowJo show Elapsed Time Since Last Save to show the amount of time that has past since you saved this workspace. The time counter is shown in the tool bar of the workspace window. Further options let you choose to have FlowJo display a light grid over the sample and group list to aid in visualization.� The setting Gate Statistic is Freq. of Parent allows you to specify that the percentage shown in the Statistic column of the workspace refers to the portion of the immediate parent population. Unchecked, the number will reflect the portion of all cells in the sample tube. Create new Workspace when launched is checked by default. When FlowJo opens, it opens a new workspace window as well.
Just below, you can choose how FlowJo will display the data file names in the workspace window list. When you choose to display the sample's file name from the Sample Name Keyword - FlowJo examines the FCS keyword header information and uses the sample name keyword from the data file as the file name in the workspace.
NOTE: Options chosen when acquiring your data can cause all the samples in the workspace to be named identically (i.e., each file name is missing the suffix .001, .002 etc.). To avoid this problem, choose the next option, Use Data File Name. This option displays the name as it is on the system disk (i.e. with the .001 suffix) rather than using the internally-defined keyword.
An alternative file naming option is to Specify Keywords from the data file. For instance, displaying Sample ID or Patient ID as the file name may aid in identifying your samples. Annotation such as Sample ID or Patient ID can be entered while acquiring your data or in FlowJo.
Define Sort Order lets you choose whether data will be sorted by sample name or acquisition date and time. If you want a different sort order, return to the workspace and select Sort... from the bar above the tube names. There you can select multiple criteria from among the data stored in the fcs file, sorting first by $DATE then by $ETIM for example.
The final button in the section is to set the order and size of columns visible in the workspace. If you click on Use As Default, FlowJo records the columns & spacing that you have set in the current workspace, and uses that for all new workspaces that you create.
The next option is to Remind to Save your work. By entering a non-zero value in the box, you instruct FlowJo to remind you to save the workspace every few minutes. When this amount of time has elapsed, FlowJo puts up a dialog and lets you choose to save or not to save the workspace This dialog has a checkbox that lets you specify to always use the same answer:� if you check this box and click Yes, then FlowJo will automatically save the workspace for you without interruption.
Save with Incrementing Version Number saves a new workspace every time FlowJo saves your work. The workspaces are named with incrementing version numbers (i.e., name.jo-1, name.jo-2 etc.) when the Always use the same answer box is checked upon the first save .
The popup menu for Adding Analyses to the Workspace controls how FlowJo causes recalculation of gates & statistics that are copied between subsets (or samples) to occur.� Depending on how large your experiment is, it may become cumbersome to have FlowJo recalculate all populations affected by the action of dragging a population to a group or sample. This setting will permit you to postpone recalculation on some or all samples to maintain the responsiveness of the program. The default behavior is to compute immediately (which may cause FlowJo to need to load the sample data).� You can also choose to have the statistics computed only when needed or only if sample loaded. The latter option will cause statistics to be computed only if the sample has already been read into memory (and still resides there).� FlowJo will always compute the statistics once they are requested by the Table Editor or Layout Editor... this option is designed only to control the calculation of statistics for display in the workspace window.
The next section relates to the Compensation Platform.� Often, compensation causes data to be compressed onto the bottom or left axis in displays.� This can be un-aesthetic... therefore you can choose to have FlowJo transform data display to improve visualization of the data. The Allow custom visualization checkbox allows you to apply the custom transformation from the Compensation menu and to choose the default values for the Additional Negative Display Size and the number of Positive Decades of "log" display.
The button at the bottom of this section, marked Define… goes to a separate dialog specifically for dealing with the data generated by Becton Dickinson's digital Vantage (Diva) system. This 32 bit linear data does not fit the normal data standards used by other instruments, but FlowJo has special settings to read the DiVa acquisition files.
Graph Preferences
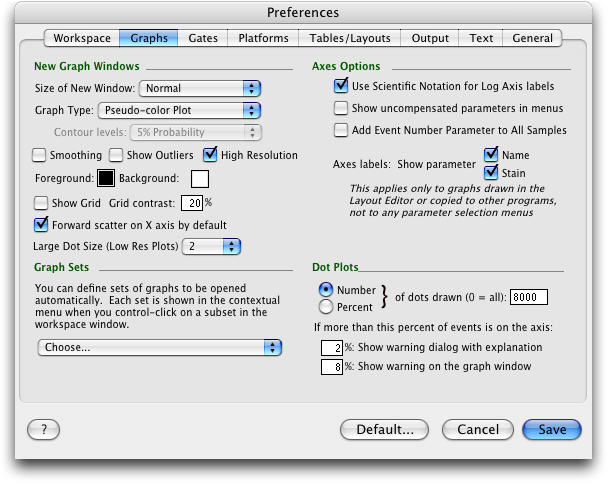
The first section holds preferences that define how a graph window should look when you first open it.
The Graph type and other options are identical to those you can specify when you open the graph options disclosure triangle on the graph itself. This will be the default graph type displayed whenever you open a sample for the first time.� To draw large dots, uncheck the High Resolution display option - these dots are twice as large in each dimension, and will be easier to see on slides or publications.
Forward scatter on X by default when checked, specifies that FlowJo shows Side scatter vs. Forward scatter the first time you open a sample's data, otherwise, it shows Forward vs. Side scatter.
The Graph Sets button opens a dialog where you can select parameters for the X and Y axes from the list of available parameters in the workspace. FlowJo will open graphs showing the combinations of the parameters you chose that are available in a selected data sample. To open graphs displaying all available graphs of the chosen parameters, Contol-click a subpopulation.
Checking Use Scientific Notation for Log Axis labels will direct the program to draw axis labels as 100, 101, 102, etc. If unchecked the labels would be drawn 1, 10, 100, etc.
Check Show uncompensated parameters in menus when you wish to have the option to display graphs using either compensated or uncompensated data. Choose the uncompensated (without brackets) and compensated (bracketed) parameters in the axes menu pulldown lists.
The Add event number parameter... option adds an additional parameter to the axes pulldown menus. The event number parameter allows you to display the cells on a plot in the order they were run through the machine. For instance, if you collect 10,000 events, and display the Event Number parameter on the X-axis, the first cell will be at the left edge of the graph and the 10,000th cell will be at the right edge of the graph. This is useful to display vs. another parameter such as scatter in order to determine if changes occurred during collection.
Next you can choose what will be included in the axis labels of Layout editor's graphs. Select parameter name, stain name or both.
If you use Dot Plots (and in general, you shouldn't!), and you have more than 10,000 events in a file, you may wish to limit the number of dots drawn to speed up display or to keep it from "blacking out" completely.� This can either be an absolute number, or a percentage of the total number of events in the population. If you enter 0 in this box, regardless of the radio buttons' settings, all of the events will be drawn.
If more than this percent of events is on the axis, FlowJo will open a warning dialog with an explanation or it will simply show a warning on the graph window. If you enter 100 in this box, the warnings will not be displayed.
Gating Preferences
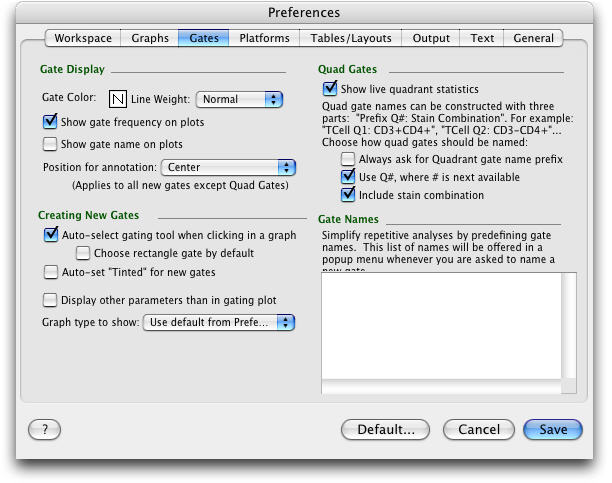
The Gate Display section groups preferences together that determine the behavior of gates (line weight and gate color) and gated populations.� Show gate frequencies on plots specifies that FlowJo should draw the frequency (within the parent gated population) of any gate drawn on a graph.� The frequency is drawn in percent.� The frequency is drawn on exported graphs whenever the gate is drawn, if this preference is selected. Show gate name on plots displays the gate name inside gate on the graph window. Position for annotation lets you choose where the identifying information for the gate will be displayed in relation to the gate itself.
Creating New Gates
When the Auto-select gating tool... option is checked, a polygon gate is started by simply clicking in the graph window. If this option is unchecked, a gating tool must be chosen from the top of the graph window before a gate will be drawn. Choose rectangle gate by default determines whether the polygon or rectangle is the default gating tool. Auto-set tinting for new gates if checked will draw the gates with a colored tint. Sometimes when exporting tinted gates, the color will become opaque and hide the data underneath the gate. Test with your presentation or graphics editing software. You can temporarily disable tinting for export or printing by choosing Edit > Disable tinting from the main menu.
Display other parameters than in gating plot... The graph for the new population will either have the same parameters as the graph on which you drew the gate; or, if the box is checked, FlowJo tries to intelligently select a new pair of parameters to display. The Graph type to show is selected by the pop-up menu. Here you can select that the new graph type is either (1) the same as the graph on which you drew the gate; (2) the same as you specified in the Graphspreferences or (3) a blank graph. The latter is useful when you are working with enormous data files, where you would like to specify the graph before FlowJo takes the time to calculate it for you.
Quad GatesShow live quadrant statistics specifies that FlowJo should calculate quadrant statistics whenever the quadrant tool is selected. If unchecked, the statistics are not displayed in the graph window while you track a quadrant gate.�Checking Always ask for Quadrant gate name prefix brings up a dialog every time you create a quad gate. This dialog asks for a prefix to attach to the quad gates - useful if you create multiple quad gates and want them to be listed together in the workspace window. Use Q#, where... puts Q1, Q2, Q3, as names on successive gates. Include stain combination adds this information to the quad gate name. At least one of these three boxes must be checked.
Finally, you can add a custom list of gate of Gate Names that you use frequently. If this list is defined, the gate name dialog will show a popup menu listing all of the names you have defined. You can either choose a name from this list or if you start typing the name of the population - FlowJo will automatically fill in the rest of the name. This will facilitate more consistant naming conventions, and reduce redundant typing.
Platform Preferences
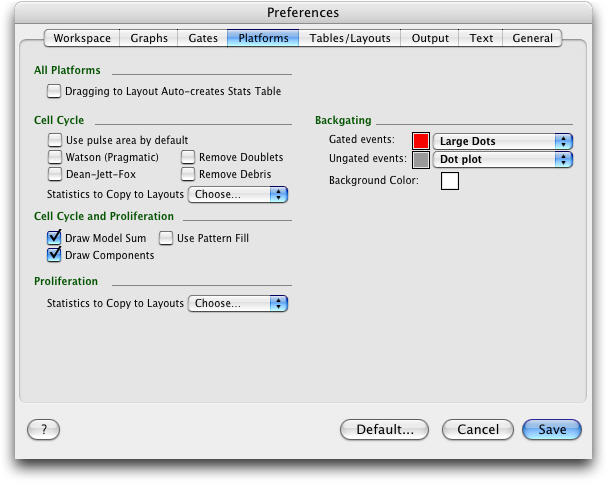
Choosing Dragging to Layout... will cause a table of statistics pertinent to the analysis to be created automatically in the Layout Editor along with the usual graphic element.
Cell Cycle - here you can declare default preferences for Cell Cycle graphs. These parameters can be changed per graph by opening the Models disclosure triangle in the graph window. Statistics to Copy to Layouts is a drop-down list where you can check the names of statistics you wish to be present in a table when you drag the Cell Cycle icon from the Workspace into the Layout Editor. See the Dragging to Layout... item just above.
Cell Cycle and Proliferation these options, also available in the graph window, will be applied to the graphs of both platforms by default.
Proliferation - Statistics to Copy to Layouts is a drop-down list where you can check the names of statistics you wish to be present in a table when you drag the Proliferation icon from the Workspace into the Layout Editor.
Backgating - These items control the appearance of the subpopulation in each of the parent graphs when you display a backgate analysis graph group.
Tables/Layouts Preferences
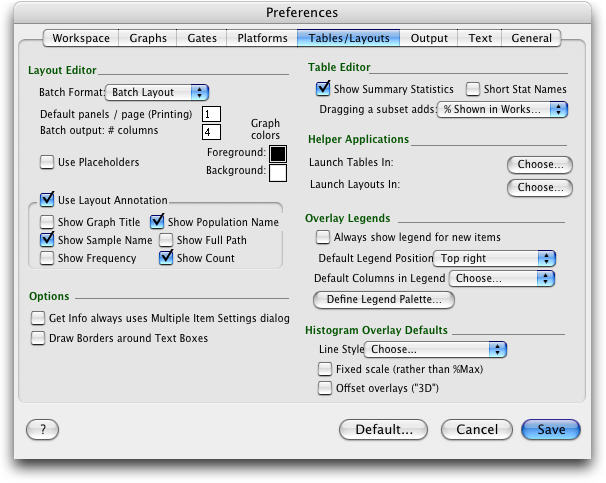
Within the Layout Editor section, you can choose the default format of batch layouts. The choices include Batch Layout, Tiled Report, Web Report, QuickTime Movie or Print Directly. You can learn more about the options here.
Next you can choose how many panels (copies of your layout with new data) you want FlowJo to arrange on each page during batching of the layout. This will control how the batched layout will look when it is printed. Just below that, tell FlowJo the number of columns in which to display your batch. Then choose default foreground and background colors for new graphs. If you chek the Use Placeholders box, you will see a simple outline with a diagonal x in place of the actual graphs in the layout.
The check boxes in the section Use Layout Annotation determine which information is included in the annotation of a graph added to a layout. The title, sample name, population, path, frequency and count can each be individually included in the annotation.
Options - Within the layout editor, double clicking on most items, or choosing the Get Info… command from the menu will edit that item's specific attributes. If multiple items are selected, then a Multiple item settings window comes up which contains all of the settings available. Setting the check box Get Info always uses Multiple Items Settings dialog will cause the larger dialog to be shown all the time. The checkbox Draw Border determines whether a line is drawn around the text boxes by default.�
Table Editor - contains only options specific to the Table Editor. Tables can optionally show summary statistics as additional rows in the output tables. If this is checked, additional rows for mean and standard deviation will be appended to the table. If the summary statistics are showing, values in the table will also be highlighted. If the value is greater than one standard deviation from the mean, it will be bold and italicized. If the value is greater than two standard deviations from the mean, it is also turns red.
The option Short Stat Names causes an alternate set of statistic names to be used in the creation of tables.� There is a tendency for the first row of tables, which contains the column headers describing the statistics, to become long and unwieldy.� This setting will reduce that effect by substituting % for frequency, P for parent, and G for grandparent.
Helper Applications - The Layout Editor and Table Editor have buttons ![]() that will cause the current screen to be written to a file and then launched by a different
program. For the table editor, you can pick a spreadsheet or statistics package as your Helper Application. For the layout editor, you can pick a graphics or publication program. Use the Choose... buttons here to pick the applications
you wish these buttons to launch. In response to the Help button in any of the FlowJo's windows, the program will direct the Finder to launch the web Browser you have chosen in your computer's preferences, and display the HTML reference manual page
specific for the context.
that will cause the current screen to be written to a file and then launched by a different
program. For the table editor, you can pick a spreadsheet or statistics package as your Helper Application. For the layout editor, you can pick a graphics or publication program. Use the Choose... buttons here to pick the applications
you wish these buttons to launch. In response to the Help button in any of the FlowJo's windows, the program will direct the Finder to launch the web Browser you have chosen in your computer's preferences, and display the HTML reference manual page
specific for the context.
The Define Legend Palette button allows you to define the colors of the overlaid graphs in the Layout Editor. The first color by default is red and the next is blue etc. This can be changed to all black and gray scale if you do not have a color printer.
Histogram Overlay Defaults Select the line style you prefer, thicker, thinner, dashed or dotted. Tinted area without a line is also available here. Choose whether overlaid histograms each will be expressed on a common scale (checked) or each as a percentage of the maximum height of the graph (unchecked.) Finally check the last box if you wish to view overlaid histograms in a three-dimensional stack.
Output Preferences
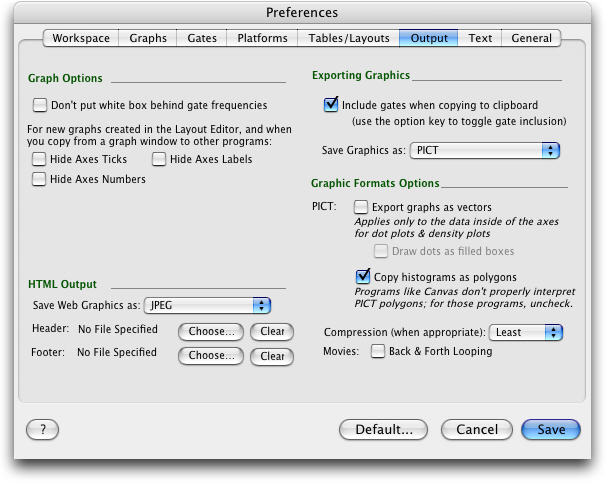
Graph Options The first box allows you to make a gate's frequency label transparent. The next three boxes control what axis info is displayed by default.
HTML Output Here you you select what format you want FlowJo to use when it saves your layouts as Web pages. Photoshop and Quicktime native formats are also available here. If you want a standard text or graphic to appear at the head and/or foot of your Web page, use the Choose button to show FlowJo where the files are. These files must contain the appropriate HTML tags to display properly. They may contain the logo or link information that you want included in the pages you create.
Exporting Graphics Graphs are copied without gates showing by default. Check this box to include gates when copying. Option - clicking will reverse this choice on a per graph basis. The drop-down list here lets you choose the file format of exported graphics.
Graphic Formats Options Check your preferences for PICT graphic properties. Vector objects within exported graphs can be edited separately, allowing more control of the image after it leaves FlowJo. Drawing dots as filled boxes allow you to control their size in a vector graphic program. It is efficient to display histograms as polygons, but some programs will not display the polygons correctly. Uncheck this box if your exported histograms are corrupted. Next you can choose the level of compression of exported graphics. Lossless compression gives the clearest display but the largest file size, Most compression gives the smallest file size but the least fidelity to the orginal appearance of the graph. Check the Movies Back & forth Looping box to cause quicktime movies of your batched graphs to cycle back and forth rather than jumping from the end to the beginning when they repeat.
Text Preferences
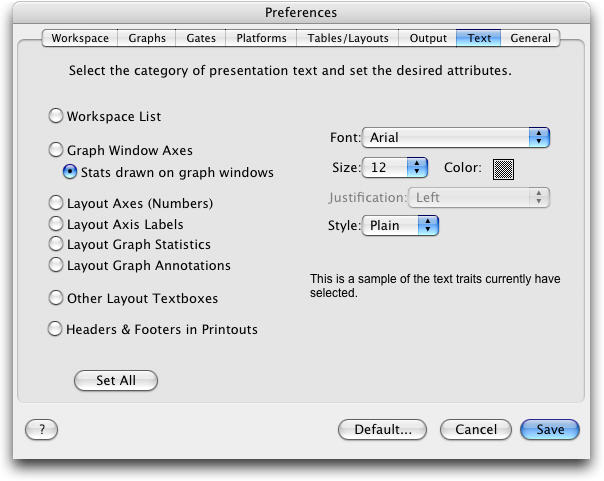
The Text tab collects the controls for all of FlowJo. Choose the text placement from the list on the left, then set the font, size, color and so forth on the right. Or, choose the settings for one area, then click the Set All button to have the same attributes applied everywhere.
General Preferences
�
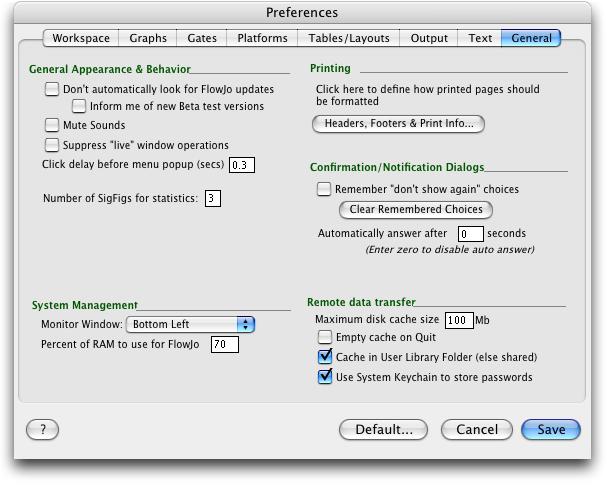
General Appearance & Behavior Updates between versions (8.x 8.y 8.z) are free. Check this box only if you do not wish to know when there is a free FlowJo update available. Check the second box to be notified when Beta versions are available for testing. The third checkbox will mute FlowJo's sound feedback. If dragging windows takes too long on your computer, you can check the Suppress Live Window Operations checkbox. You will see a placeholder during the window moves. You can adjust how quickly pop-up windows open by specifying your preference (in seconds and tenths of seconds) in the next box. Finally, you can specify how many significant figures you want FlowJo to calculate when computing statistics.
System Management FlowJo has a task monitor window, a small status bar that displays the current number of graphs and calculations it is currently working on. Because its workload can sometimes get quite extreme, the monitor window can be useful in assessing how much longer you have to wait. FlowJo's task monitor window can be positioned in any corner of your monitor, or you can turn it off with this drop-down list. Here also, you can specify how much of your computer's RAM to use for FlowJo's operation.
Printing This menu allows you to define the headers and footers for printed pages. If you print the workspace window, a table or a layout, information such as the date and workspace name show up as headers and footers on each printed page. Click this button to type in your own text, choose from special strings (such as date and time) and even to place graphics at the footer, header or in the background of each printed page.
Confirmation/Notification Dialogs Here you can control how FlowJo handles warnings. Some choices will show you a confirmation dialog to be sure you want to perform the indicated action. If you wish, you can shut off these checks, then restart them if you need them. You can also control how long FlowJo will wait for your response before taking the action you ordered. Enter zero and it will never take the action without your confirmation.
Remote Data Transfer The settings within this box are only used by a small number of sites that provide centralized data storage for their FCS files. For some sites, FlowJo retrieves data over the internet; in these cases, you can select a maximum cache size that FlowJo uses to keep copies of the data on your Macintosh (and, if you desire, to have FlowJo delete the cache files when you quit). If files are stored remotely, FlowJo can use FTP or HTTP to download them to your Macintosh as they are needed. To speed up subsequent access to the same files, FlowJo maintains a cache on local hard drive. These settings will determine the maximum size of the cache, and whether the program should delete all of the files when it quits.