
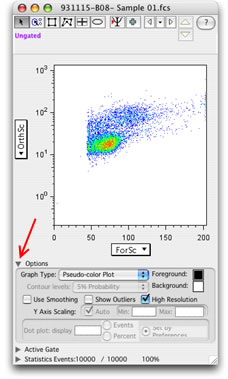
Specifying the Graph View
When you open the Options disclosure triangle at the bottom of the graph window, the options below are shown. From this window, you can modify the attributes of the current graph (or currently-selected gate). The first time you are shown this window, the bottom three sections are hidden; click on the black triangles to reveal them.
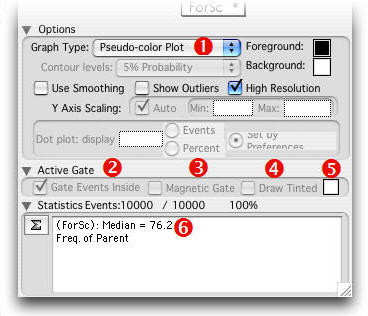
- Select the type of graph you wish to display... Contour, Dot Plot etc.
- The gate can be inclusionary (checked) or exclusionary (unchecked.)
- Check here to make the gate adjust automatically to the density of events.
- Check here to add a transparent overlay to the gated events.
- Click this box to choose a color for the transparent overlay.
- Above the white box is the number of events gated, the total population, and the Frequency of total. Inside the box are any statistics already applied to the population.
Use the gating tools (top) when you want to create a new gate of a particular kind. The Quadrant tool is a special case: it creates four gates (click here for more information). The next section lets you select which parameters to view; the third section defines the graph type and options. The fourth section is disabled unless the current graph is a histogram or CDF, in which case you could select to change the vertical (Y-axis) scaling for the plot. Finally, the bottom section is enabled whenever you have a single gate selected in the graph window. Here you can choose to gate for events inside or outside the gate, and choose to draw the gate in a different color than the default. Tinting the area inside the gate only alters the drawing of the gate; it does not change the colors of any events (dots) on any of the graphs.
Magnetic gates automatically move to accomodate the maximum event density. For more information, click here.
The preferences dialog specifies whether you must click on a gate tool to create a new gate; or whether FlowJo will auto-select a gate tool when you click in a graph window.
To make selected changes, you must click on the Apply button, which becomes active once the attributes of this window do not reflect the current graph. If you hold down the option key while pressing Apply, then the graph specification is applied to ALL open windows (at least, to those where it can be applied).
You do not have to close this window; you can leave it in one corner of your screen. It automatically updates itself to reflect any new graph window that you open.