Magnetic Gates

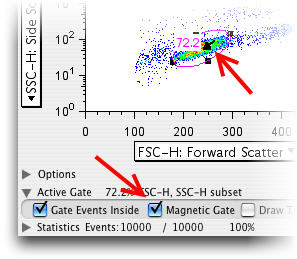
Draw any gate in the Graph Window and you can make it magnetic by clicking on the appropriate option in the Graph Tools Window. Once you make a gate magnetic, FlowJo moves it until it accommodates the maximum number of events--i.e., it relocates to where the events are. When you copy a magnetic gate from one sample to another, it is automatically readjusted. If a parent gate is modified, then the magnetic gate is again recalculated to accommodate the maximum number of events.
This is useful for instances where the population may move slightly from sample to sample and you don't want to have to individually adjust each sample's gate.
When FlowJo moves a magnetic gate, it draws a black arrow in the graph. The arrow is drawn from where the gate was originally set to where the gate has been moved by FlowJo. If the gate only moves a short distance, you may have to drag aside the white Frequency of Parent label to see the arrow. Gates which move a long distance should be checked for correct positioning!
Magnetic gates are, in every other way, exactly like normal gates: you can create subsets and add statistics to populations based on magnetic gates. They are supported in both univariate (histogram) and bivariate gating tools.
The workspace displays the presence of magnetic gates by changing the icon to a magnet, shown here in the Lymphocytes ->
