
Tables
A requirement of many experiments is the ability to generate tabular output for further analysis in a spreadsheet or statistics program. The table editor is the means by which you can generate a series of statistical calculations for all samples in a group. These statistics can be any of the statistics FlowJo calculates: medians, frequencies, etc. You can also use this tool to generate functions that will display their output for every sample in a group. In order to generate a table, you will first have to generate the statistics you wish to export on at least one sample.
From the workspace window, open the table editor. This can be done in one of two ways: either click on the table editor function button
![]() in the workspace window, or select the Table
Editor from the Windows menu (command-T).
in the workspace window, or select the Table
Editor from the Windows menu (command-T).
Use the Table Editor to create a new table definition. A table definition is not the output data itself.� Instead it is the specification of what columns the table will contain, when it is generated.� You can have as many table
definitions in the workspace as you wish.� You can create new empty definitions, ![]() duplicate existing ones,
or delete them using the button in the top left corner of the window. Each different table definition in the table editor is a different template.
duplicate existing ones,
or delete them using the button in the top left corner of the window. Each different table definition in the table editor is a different template.
To add statistics to a table definition, simply click on them in the workspace window and drag them to the definition pane on the right hand side of the table editor window. (You can use the control and option keys to modify whether or not you want to take all the parents or children, respectively; for more information, see the pages about dragging and dropping nodes.)
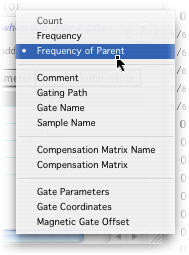
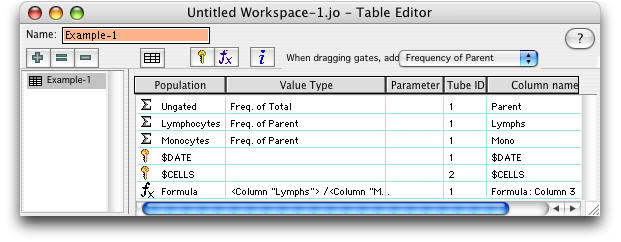
When you drag a population node into the table editor, it assumes that you want the statistic that is set as your default in the Preferences on the Tables/Layouts tab. You can change the default choice there or in the drop-down menu shown at the right, in the Table Editor.
Each statistic in the right panel of the table editor will correspond to a column in the output table; you can change the order of these columns by clicking and dragging the statistics around. The table is created for those samples in the currently-selected group: remember to click on the appropriate group in the workspace window before you create the table!
Only drag statistics from a single sample into the table editor. The table editor will automatically calculate these statistics for each sample in the group. When you apply or create a table, each row in the table editor is applied to every sample in the current group--irrespective of which node you actually dragged into the table.
When you create a table, FlowJo will cycle through all of the samples in the currently-selected group. For each statistic node that you have dragged into the table definition, it searches for the same node in each sample. If the node does not exist, then it leaves a blank for that entry. (For instance, if the statistic you copied was the median FITC fluorescence of a Lymphocyte gate, and the Lymphocyte gate does not exist in all samples, then those samples will have blank values for this statistic). Therefore, the statistics are only gathered for those samples which have the appropriate gates and statistics already applied to them.
![]() Keywords The table editor also supports including sample file keywords. A keyword is any attribute listed in the text section of the FCS file.� Above the list of columns is abutton with a picture of a key on it.� Press this button
to bring up a dialog which will allow you to select the keyword(s) to be included in the table.� You can use shift- and command- clicking to selection multiple items from the list. Keywords are appended to the table definition.�There is a list of
standard keywords, as defined by the FCS specification. Note that not all files will contain all keywords.
Keywords The table editor also supports including sample file keywords. A keyword is any attribute listed in the text section of the FCS file.� Above the list of columns is abutton with a picture of a key on it.� Press this button
to bring up a dialog which will allow you to select the keyword(s) to be included in the table.� You can use shift- and command- clicking to selection multiple items from the list. Keywords are appended to the table definition.�There is a list of
standard keywords, as defined by the FCS specification. Note that not all files will contain all keywords.
 Functions
The Functions tool will construct a function column in the output table. The GUIcan be triggered from the Table Editor by clicking on the fx button. It allows users to create a numerical, logical or programmatic relationship between
existing Table Editor columns, much like a spreadsheet editor's “reference calculations”. For details on using the function tool, click here.
Functions
The Functions tool will construct a function column in the output table. The GUIcan be triggered from the Table Editor by clicking on the fx button. It allows users to create a numerical, logical or programmatic relationship between
existing Table Editor columns, much like a spreadsheet editor's “reference calculations”. For details on using the function tool, click here.
 Define Column Attributes You can choose to have certain statistics highlighted in the output table. FlowJo will specially
format data whose value or standard deviation meets criteria you choose. For example, “I want to add a ratio of my CD4/CD8 values. If the ratio is >2, I want my values colored green. If the ratio is
<2>Define Attributes tool, click here. You can also access this tool by Double-clicking on any column definition (a row in the table definition window), or choose Special
Formatting… from the Tables menu.�
Define Column Attributes You can choose to have certain statistics highlighted in the output table. FlowJo will specially
format data whose value or standard deviation meets criteria you choose. For example, “I want to add a ratio of my CD4/CD8 values. If the ratio is >2, I want my values colored green. If the ratio is
<2>Define Attributes tool, click here. You can also access this tool by Double-clicking on any column definition (a row in the table definition window), or choose Special
Formatting… from the Tables menu.�
Iteration Options Just like batching in the Layout Editor, you can select how you want the Table Editor to batch through the tubes in the current group. Tables > Iteration Options... in the main menu opens the Iteration Options Dialog. Double-clicking on the table name will also open this tool.
In generating a batch table report, each row of the table represents a unique instance of the iterator values.� So, if you interate by nth, if n = 1, you get one row for every sample in the group; if n = 2, you get one row for every other sample.� If you iterate by a keyword value (for example, “Sample ID”), you get one row for every unique value of this keyword in the current group.
The discriminator tells FJ how to select each statistic from the samples which share the current iterator value.� You can specify multiple discriminator keywords.� A statistic is chosen for the first sample tube which has the current iterator value, as well as a matching value for all discriminator keywords as did the sample that was dragged into the table definition to begin with.
The Table Editor has a new column, Tube ID.� This shows the value of the discriminator for the sample that was dragged in to the table definition.� Thus, if we iterate by nth, and n = 2, then if you drag a statistic from the first (or third or fifth) sample into the table, it will show an ID of 1; if you drag a statistic from the second (or fourth…) tube, it will show an ID of 2.� If you choose keyword for discrimination, the keyword value is shown here.
![]() Generating the Table. Once you have put all the desired statistics and keywords into the table definition, click on the Table button in the top left corner of
the definition window. This will invoke the table generation process. FlowJo will cycle through all of the samples in the current group, and calculate all possible statistics and keywords that are in the table definition. It will then create a new
window containing a spreadsheet-like view of the statistics.
Generating the Table. Once you have put all the desired statistics and keywords into the table definition, click on the Table button in the top left corner of
the definition window. This will invoke the table generation process. FlowJo will cycle through all of the samples in the current group, and calculate all possible statistics and keywords that are in the table definition. It will then create a new
window containing a spreadsheet-like view of the statistics. ![]() This table can be saved to the clipboard or a file, printed or exported to another application. Each
of these operations is initiated via the buttons in the top left corner of the table window. The spreadsheet application launched by the Save
and launch application button (fourth from left) is chosen the first time you use this function and can be altered in the Layout pane of the Preferences
window.
This table can be saved to the clipboard or a file, printed or exported to another application. Each
of these operations is initiated via the buttons in the top left corner of the table window. The spreadsheet application launched by the Save
and launch application button (fourth from left) is chosen the first time you use this function and can be altered in the Layout pane of the Preferences
window.
Sorting the Table. Many times it is useful to view the table ordered by the value of a keyword or statistic. To sort the table, double click on the header of the column by which you wish to sort. By default, sorting the table will order the rows in descending order of the values in that column. If you wish to reverse the order, and view the table with the smallest value first, then double click the column again to invert the row order.
![]() Transfer Table to the
Layout Editor. Click this button and the existing table is copied to the currently openlayout in the Layout Editor. Click here for more information on editing the table once it is in the Layout Editor.
Transfer Table to the
Layout Editor. Click this button and the existing table is copied to the currently openlayout in the Layout Editor. Click here for more information on editing the table once it is in the Layout Editor.
Copying Part of a Table. Normally if you copy a table, the entire table will be copied to the clipboard, regardless of the current selection. If you wish to copy just a portion of the table, you can select any number of cells, and hold down the option key while performing the copy (either via the button in that window or the Copy command in the Edit menu). If the option key is down, then only the selected cell contents will be put on the clipboard. If the selection is rectangular, then pasting the clipboard into a spreadsheet or word processor will result in output that looks the same as in did in FlowJo's table. If you have used the command key to select an odd shape or disjoint selection, then the resulting paste may not look the same as it did in FlowJo's table. The rule is that all cells that are in the same row in FlowJo's table will come out in the same row on the clipboard (i.e., will be separated by tab characters), and cells that are on separate rows will end up on separate rows (i.e., will be separated by carriage return characters), but gaps between either rows or columns will be omitted.
![]() Creating Groups from the Table
Selection. Sometimes it is useful to be able to use the results from the tables to refine analysis in the workspace. To facilitate this, the table window has a button similar to the one in the workspace for Create Group operation.
Clicking this button will create a group containing all of the samples which have one or more selected cells in the table. You don't need to select the sample name. Any cell in that row will be sufficient to include that sample in the new group.
Creating Groups from the Table
Selection. Sometimes it is useful to be able to use the results from the tables to refine analysis in the workspace. To facilitate this, the table window has a button similar to the one in the workspace for Create Group operation.
Clicking this button will create a group containing all of the samples which have one or more selected cells in the table. You don't need to select the sample name. Any cell in that row will be sufficient to include that sample in the new group.
For example, we might be interested in producing graphical output of all of the samples whose CD45 positive population is over 60% of total events. To accomplish this, you could generate a table containing the statistic for CD45+, sort the table by this column, click the first cell, shift click the last cell that has a frequency over 60%, and then click on the New Group button in order to create a group of all samples with a selected cell. Then go back to the workspace window, and select the new group, limiting the view to only the desired samples. Now when you generated the desired layout, you will only be looking at those samples that have the desired characteristics. (If this sounds overly complex, relax. It's easier to do than to explain.)
 Resize
Columns Click on this button to resize the table's columns to fit the text in the header.
Resize
Columns Click on this button to resize the table's columns to fit the text in the header.
![]() Finally, you can choose to save the resulting table to a disk file, copy to the clipboard or print. Saving to a disk file is probably the best choice; you can then import the
data into a spreadsheet. Any spreadsheet should be able to import the data; specify that the first row of the table has the column headers.
Finally, you can choose to save the resulting table to a disk file, copy to the clipboard or print. Saving to a disk file is probably the best choice; you can then import the
data into a spreadsheet. Any spreadsheet should be able to import the data; specify that the first row of the table has the column headers.
Column Names.� In the output file, the first line has a tab-delimited list of column names.� Each column name is a concatenation of the full name of the population (including all "parents") and the statistic name itself.� For example, "Lymphocytes/CD4:Freq. of Parent" would be the name for the column with the frequencies of CD4 cells within the Lymphocyte gate.� These names can become unwieldy in length... you might want to keep your subset names as short as possible.� In addition, you can have FlowJo export abbreviated statistic names (in the example above, "Freq. of Parent" would be replaced by "%P").� You can set this preference in the Preferences on the Tables/Layouts tab.
Replace Column Names. You can type in any name you wish to replace the statistic names in the generated table. In the Table Editor, type in the new names in the Column Name column. When you create a table, these names will be displayed instead of FlowJo's statistic name.
Drag and Drop, Copy and Paste You can drag a table or copy it from the Layout Editor in one Workspace into the Layout Editor of another.