Defining Column Attributes
 Info Info Button |
You may want to highlight certain results when you create a table with the Table Editor . FlowJo lets you change the formatting of table values based on their relationship to standard deviation or a numerical value. Select a row in the Table Editor and click on the Info button. This brings up the tool below...
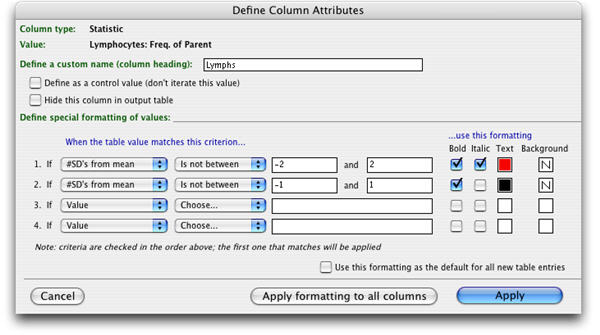
In the Define a custom name... box you can create a name for the column when it appears in the finished table, or override the name it was given by default in the Table Editor.
Check the Define as a contol value... box if you do NOT wish this column to be batched when the table is created.
Check Hide this column in output table to perform the indicated calculation but to prevent it being displayed in the final table.
Next note the blue text reading,"When the table value matches this criterion... use this formatting." Choose your criteria on the left, and values that satisfy them will be formatted according to your selections on the right. By default, FlowJo's tables will make 2>SD>1 values bold, red and italic, and SD>1 values bold and black.
Values in the selected column will be checked against the criteria you list here, in the order that you list them. As soon as a criterion is satisfied, the corresponding formatting is applied and the next value in the column is examined.
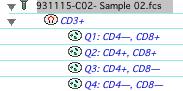
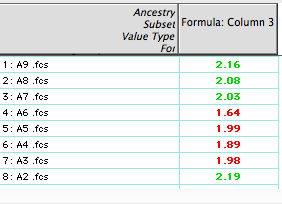
Example: “I want to add a ratio of my CD4/CD8 values to the table. If the ratio is >2, I want the values in my table to be green. If the ratio is <2> First, we'll need some kind of gating in the workspace. In this example, I used the Workspace at the right.
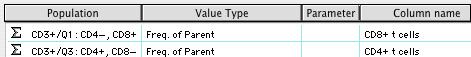
Next, drag the nodes that correspond to CD4/8 T cells to the Table Editor. Notice the Column Name field is filled in:
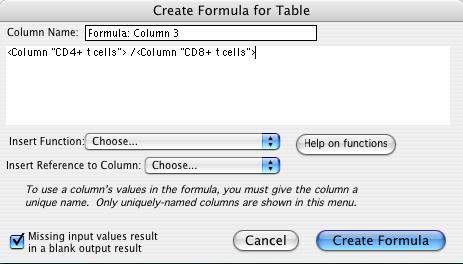
Next, click the Function button ![]() in the Table Editor and define a ratio of
CD4 to CD8. Select the blue Create Formula button
shown below. For explicit instructions on functions click here.
in the Table Editor and define a ratio of
CD4 to CD8. Select the blue Create Formula button
shown below. For explicit instructions on functions click here.
Now, double click the new row in the Table Editor to style the output:
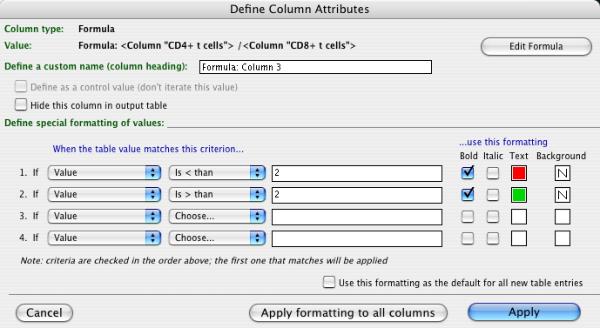
Click the Create Table button in the Table Editor. If the ratio is >2, the values in the table will be bold and green. If the ratio is <2 the values will be red and bold.