Autogating Tool
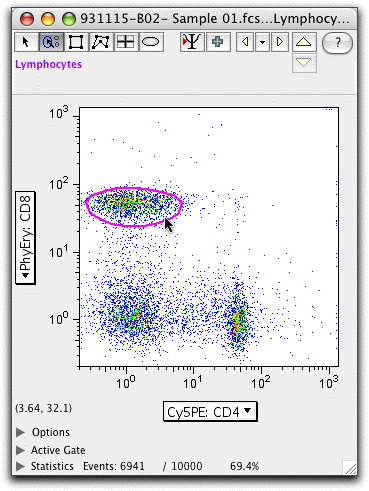
Click on the Autogate tool button on a bivariate graph window to activate the autogate feature. When moving the mouse over the graph, FlowJo will automatically find subpopulations to gate. These are shown on the graph window and change based on the position of the mouse. Simply click once to create a polygon gate when the population of interest is circled.

The region that FlowJo finds will include the region that has at least as many cells as the point under the mouse-move the mouse to a more densely populated area, and the gating region shrinks.
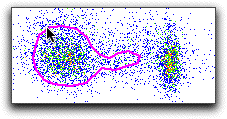
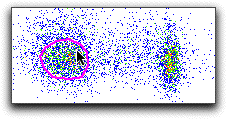
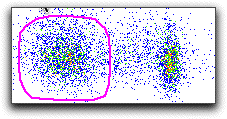
After you click down on the mouse, and before releasing the mouse button, you can fine-tune the gate-just move the mouse up or down to increase or decrease the size of the gate. Note in the figures below, the goal is to identify the left population using the autogating tool. Note that in the first figure, the autogate tool starts to include the right population in the gate. To prevent this, the mouse was clicked and the button held down when the gate was centered on the population of interest (middle). With the mouse button held down, the mouse can be moved up and down to change the size (not the shape) of the gate (bottom).

|

|

|
This polygon gate created using the autogate tool acts identically to any other polygon gate. It can be adjusted by hand. It can be dragged to other samples (note the gate on the other samples will be exactly the same as the initial gate - adjustments will not be made according to changes in the contours of the other samples). If you would like to have a gate adjust its position automatically according to the data displayed from different samples, try our magnetic gating feature. HINT: To choose the autogate tool automatically (without clicking on the button at the top of the graph window), hold down the "control" and "option" keys as you move the mouse over any bivariate graph.
