Dot Plots
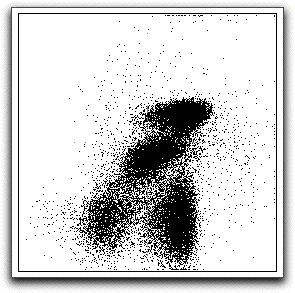
In a dot plot display, FlowJo draws dots for events. The default number of dots to draw is 8000.. You may change the number of events drawn in a dot plot via the Preferences dialog. You can also have FlowJo draw "large" dots, which are twice the size in both dimensions as small dots. This may make the display easier to see in publication or slides. This option is set via the Preferences dialog.
Dot plots also suffer from the under-emphasis of populations that are tightly-grouped. A more balanced representation is found with contour plots, especially with outliers displayed.
Shown below is a typical dot plot graph. Axes are removed for simplicity.

You may view a comparison of all the bivariate displays for this same data.
