
MultiGraph Overlay
FlowJo can display multiple subpopulations of a single sample overlayed on one for visual comparison. Overlayed subpopulations are distinguished by color - the color of a subset allows easy assessment of its characteristics on multiple plots. In addition to being able to display previously gated subsets of cells in overlay plots, you can start with an ungated sample and create gates directly in the MultiGraph Overlay platform itself.
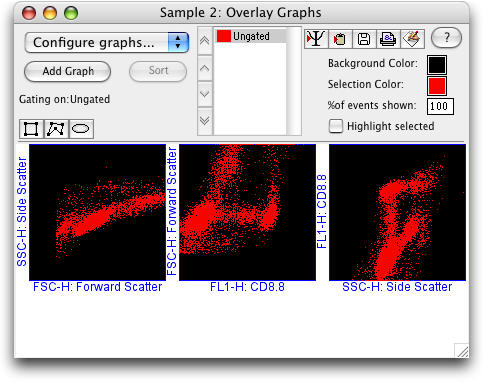
Click once in the Workspace window on the sample you wish to analyze. Choose MultiGraph Overlay from the Platform menu. This brings up a window similar to the one below.
Graphical Display
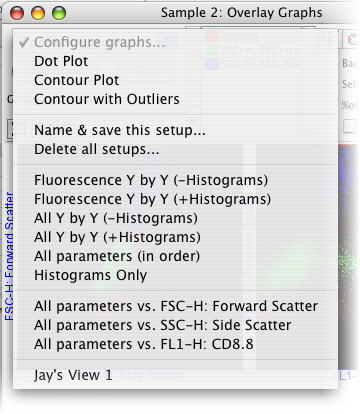
From the Configure Graphs pulldown there are various choices (SEE graphic at right) for laying out graph sets.
With one click you can open a variety of graph setups. For example, Fluorescence Y by Y (-Histograms) opens a group of graphs showing each possible combination of two Y axis fluorescence parameters but does not include a graph of their histograms overlaid. All Y by Y (+Histograms) displays a group of graphs showing all bivariate combinations of Y axis parameters plus a graph with all their histograms overlaid.
If you wish to customize the display you can:
-Add graphs (click the Add Graphs button)
-Delete graphs (click on the graph and choose delete from the popup menu)
-Change graph axes (click on the axis label)
-Move graph to end or beginning (click on the graph and choose from
popup menu)
-Display a fraction of the events (change the percentage in the box at the top right)
-Change the color of the selected subpopulation or of the background of all plots
Save the customized display by choosing Name and save this setup from the Configure graphs pulldown menu. Saved setups will appear at the bottom of the Configure graphs pulldown menu.
Subpopulation names. The names of the gated subpopulations are displayed in the middle box of the MultiGraph Overlay window. These subpopulations can be sorted by clicking the Sort button (FlowJo will sort the subsets in a hierarchical manner with the subset containing the most events at the top of the list). In addition, you can highlight a selected subpopulation by checking the Highlight selected box.
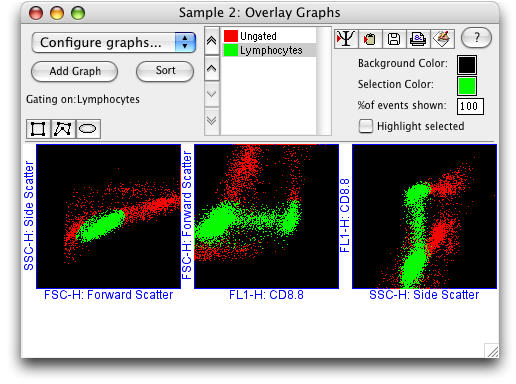
Creating gates on a MultiGraph Overlay. Select a population from the list where you wish to create a gate (top center of the MultiGraph Overlay window). Click on a gating tool and create a gate in a graph window. The cells that fall in the gates subpopulation are displayed in color on all the graphs. Each subpopulation you create is displayed in the Workspace window under the sample name.
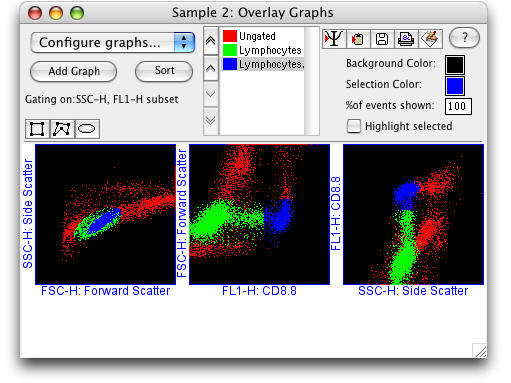
Overlaying previously gated subsets. You can also drag and drop a gated subpopulation node from the Workspace menu to the MultiGraph Overlay list. The cells that fall within this gate are now displayed in a different color.