
Grids
FlowJo's Layout editor contains a tool for creating grids inside your layouts. In the right margin tool bar, click the grid icon.
Drag out a rectangle where you want your grid to be. FlowJo will respond will a dialog asking for the dimensions of this grid:
Fill in the dimensions and click OK, you will see a grid appear in the layout editor:
A grid is made up of cells, aligned in rows and columns. You can drop any text, chart or picture into a cell. You can even embed grids inside of other grids. Below is a grid containing six different graphs. The grid container makes it easier to align graphs and to work with them collectively. When you drag a grid to a new location in your layout, all of the contents of the cells move with the grid as a group.
Mouse click behavior
If nothing is selected in the layout, then the first click anywhere in the grid will select the entire grid. If the grid is selected, then mouse clicks are passed down into the cell. To drag a grid to a different location, you must deselect it (by clicking in the background of the layout, or on a different item) and then click and drag the grid in one step. If the grid is already selected, then a click-and-drag motion will select a cell and drag its contents.
There are additional grid commands in the Layout menu. Put Into Grid places selected layout elements into a one row grid with each item in its own column.
Other commands are available when a grid or its contents are selected:
The Transpose Grid command changes the number of rows to the number of columns and the number of columns to the number of rows. So a 3 column by 2 row grid becomes a 2 column by 3 row grid. Items are not moved among cells, but if the cell moves, the item moves with it.
|
For example, Transpose Grid makes the grid at left into the grid at right. |
|
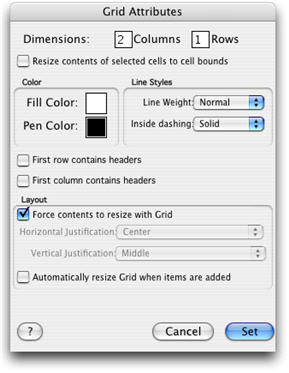
Also in the Layout menu is the Get Grid Info command. Clicking this command opens the Grid Attributes window shown at the right. You can also reach this dialog by double clicking on a grid's border, or select any part of the grid then select Get Grid Info from the Layout menu.
The first items dictate the dimensions of the grid; the number of rows and columns it contains. Set the desired lengths here to change the size of the grid. Note that eliminating cells can cause cell data to be lost.
The Fill Color and Pen Color will determine the colors used in drawing the background of the cells and the lines in the grid. Note that graphs you have placed in the grid are drawn on either a white or a black background (depending on the Inverted flag for that graph), and are not affected by changing the fill color. The area under the labels and surrounding the graph is affected by changing the fill color. Here you can choose line weight, colors etc. for your grid. You can also choose to have the grid adjust to the size of the items inside, or to have the graphs and other items resize themselves within the available grid space.
The Line Weight option determines how thick the lines in the grid will be. The Inside dashing options lets you choose solid lines, or different lengths of dashed lines between the cells in the grid. The outside edge of the grid will always be solid, and is unaffected by this setting.
The settings First row contains headers, and First column contains headers are provided so that FlowJo can resize grids more intelligently. When the program knows to treat the first row or column separately, then it can avoid scaling all cells proportionally during a resize. This reserves more of the space for the actual content, and produces a more aesthetically pleasing graphic.
The group of items called Layout will determine how the cell content is positioned in the cell rectangles, and what will happen to them if the grid is resized. If the Force contents to resize with grid checkbox is set, then the full content of the graph or pictures will be rendered in the grid, regardless of the cell size. If this setting is not checked, then the chart or graphic will remain its original size, and if the cell size is smaller than the graphic, then only the top left corner of the image will be visible. This setting is available for the grid as a whole, and not for each cell individually. To accomplish independent scalings you must rescale graphics outside of the grid, and then drag them into it at the desired size.
Deleting Cells, Rows & Columns from a Grid
To delete elements of the table, click on a cell and hit the delete key. You will see a dialog box requesting information about what aspect of the table you want to delete. You can choose among removing just the currently selected cell contents, or removing the entire row or column that includes the selected cells. Using the command and shift keys, it is possible to select multiple cells of the table and perform several deletions in one step. You may also drag an element out of the grid and delete it with the delete key in the usual way.
Shortcut:
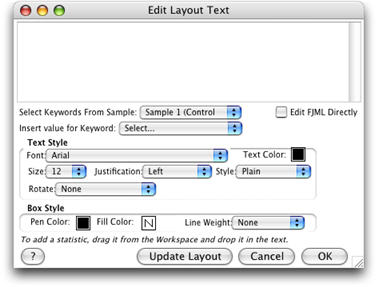
Hold down the Option key and double click in a cell to add a textbox, and activate the FJML editor. This tool will create text annotations of statistics that remain linked to the FlowJo workspace. When you update gates or otherwise alter details of the analysis, these annotations update themselves to match. Click here for instructions on use of this tool.