Backgating
FlowJo's backgating analysis provides a tool to view the effect of every gate in the gating tree on the final gated population.

The backgating icon shows up graph window for a subset that is gated more than once (or you can choose "Backgating Analysis." under the Graph menu).
When you click this button, FlowJo shows you a window where each level in the gating hierarchy is displayed, with the final gated population overlaid at each level. This overlay is a backgating overlay: in other words, it shows what the final gated population would look like without that level's gate. Therefore, you can quickly scan to see if any one of your gates is positioned incorrectly. The backgating display can be printed, copied, or saved in the SciBook.
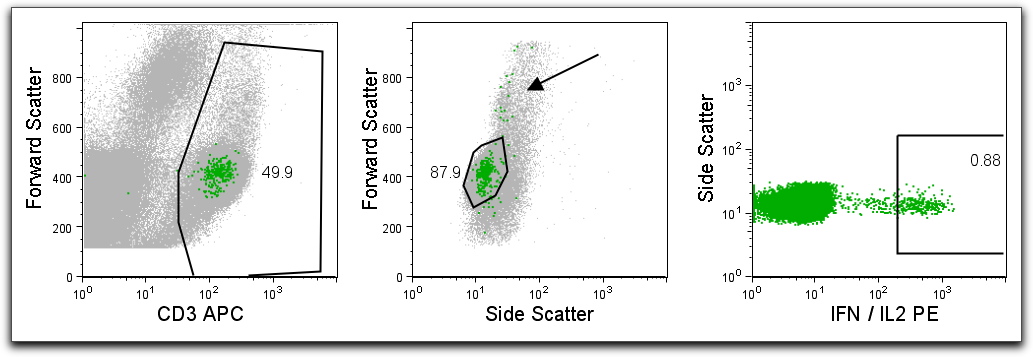
Above is an example of backgating analysis on an intracellular stimulation. PBMC were stimulated and stained for CD3, CD4, CD8, and cytokines. Backgating analysis helps validate gate positions. Here, a typical cytokine gating analysis shows that cytokine producing cells have a different distribution than expected for most T cells, and that the gates should have been widened in some cases to accommodate this (see arrow).
A typical gating scheme was used to identify T cells (CD3+, left), lymphocytes, then CD8+CD4- T cells, and then cytokine producing cells (far right). The backgating analysis shows how each gate affects the identification of events. In each graph, the dots shown in green are fully gated cytokine positive cells. The gray dots in each individual graph show how the final gated population (ie cytokine positives) would appear had that single gate not been applied. Thus, in the second graphic, it is apparent that some CD3+ T cells producing cytokine fall outside of the typical lymphocyte gate (particularly, some appear as "blasts" at higher FS values). This analysis shows that the researcher might benefit from using a larger lymphocyte gate The backgating analysis is so critical because it reveals that the population of interest, which may be very small, could have a very different distribution from the main population.
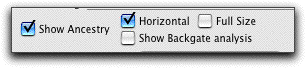
Note that the Layout Editor can also show a version of the backgating analysis, by double clicking on the graph to open the Layout Item Definition. Choose the "Show Ancestry" option and select the "Show Backgate analysis" option.