
Multi-sample Population Comparison
In FlowJo, the Multi-sample Comparison platform is used to compare single or multiple parameters from a test sample to a composite of more than one control sample.
For example, in comparing multiple samples against each other, it is sometimes not possible (or meaningful) to assign a single sample as the control, against which all others are to be compared. In such a case, the Multi-sample Comparison platform can concatenate all of the control samples in order to use the average of all the control samples for comparison. This process mitigates the potential artifact introduces by selection of a sample as control that is actually significantly different than the expected control sample.
Determining the samples to be concatenated is best approached by an iterative process. One can concatenate all the control samples and compute the distances of each control sample to the average of all of them. Thus, those control samples which are outliers can be removed from the control set. Caution is warranted since reduction of the number of samples entered as controls can lead to sampling bias.
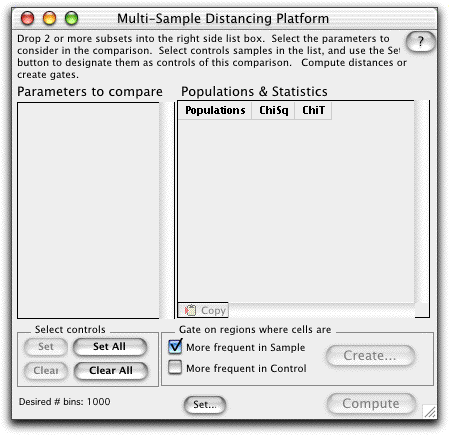
Start by selecting the Multi-sample Comparison Platform from the Platforms menu. Note that this platform does not associate with a particular population.
Drag two or more samples (or subsets of the same sample) to the right side of the platform into the Populations and Statistics box.
Select the control samples in the list by clicking (they become shaded). Click the Set button (under Select controls) to designate these samples as controls (they become red). All of the samples can be designated controls by clicking the Set All button.
Check the boxes on the left to choose the Parameters to Compare.
The number of bins can be set according to the number of events collected. Click on the Set... button at the bottom of the window to set the number of bins.
A gate based on the differences between the two samples can be created by clicking Create. Visit the Gate Cut-off page for information on setting the X2 threshold.
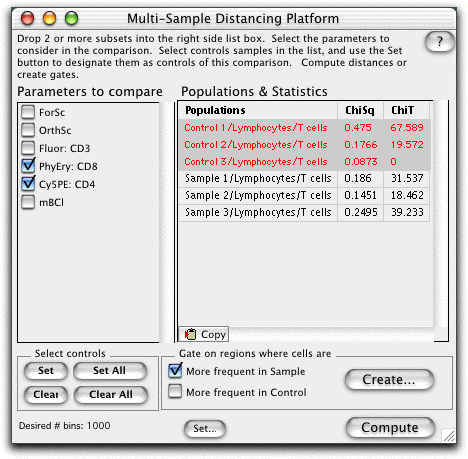
Click the clipboard to copy this table to clipboard.
The Chi Squared Test divides the concatenated control sample into bins with the same number of events, divides the test sample along the same boundaries and calculates the Chi Square of the two binned data sets. The X2 is converted into a metric (T(X)) that can be used to estimate the probability that each test population is different from the concatenated control population. See the Population Comparison Overview page for a complete explanation of this statistic.
When T(X) = 0, the two populations are indistinguishable (p = 0.5) and when T(X) = 1, the populations differ by one standard deviation, giving the probability that the two populations differ p < 0.17. A value T(X)> 4 implies that the two distributions are different with a p < 0.01 (99% confidence). However, the minimum value of T(X) that has biological significance depends on the nature of the data being analyzed and therefore needs to be determined empirically. Only populations which have T(X) values larger than this empirical minimum can be considered to be different.
Several populations can be compared in order to determine the minimum T(X) value. Machine stability during the collection, as well as inherent variability in the FACS data are just two reasons why the comparison of a population to itself can give a T(X) > 0. You can compare the same sample collected twice. Collecting one sample at the beginning and one sample end of the collection process best determines the machine stability. Or compare several different samples that have been treated with the same stimulation.
The number of bins that the test and control sample are divided into should be maximized to most easily detect small differences between populations; however, the number of bins can become limiting for this statistic (depending on the number of events collected and the number of parameters compared). Therefore, a reasonable number of bins is roughly 10% of the event count - leading to a minimum of about 10 events per bin.
As the number of parameters being compared increases, then more events may need to be collected in order to distinguish subtle variations in the populations. However, inclusion of parameters in the comparison which Do Not vary between populations does not degrade the ability to distinguish the populations.
Note that the computations in the Multi-sample Population Comparison platform are memory intensive. You may need to allocate more memory to FlowJo (more information on memory requirements).