Population Comparison
Multi-sample Population Comparison
Chi Square Cut-off Value Selection
Use the Multi-Sample Distancing Platform to reach this stage of your analysis...
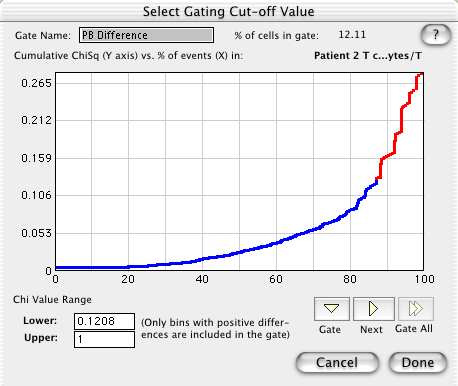
In order to create gates based on the differences between the control and the test sample(s), the threshold/cut-off Chi square value must be selected. When computing the Probability Binning algorithm, a X2 value is computed for each bin. The union of the bins with the largest X2 values becomes the "difference gate". The higher the Chi square value, the more the control and test samples differ.
The distribution of X2 scores for each bin are graphed versus the percentage of cells that would fall into the gate if that X2 value is chosen as the cut-off value. This Cut-off graph shows the bins sorted according to their X2 value--i.e., those bins where the frequencies of events between the test and control population are the least different are shown to the left. Thus, the bins from the right edge represent those bins with the greatest difference. The default threshold is the Chi square value corresponding to those bins that are at least two standard deviations above random variation; i.e., T(X) = 2. The bins that fall above this X2 cut-off value are shown by red dots.

The threshold/cut-off can be altered by drawing a new gate (click and drag) or by entering the upper and lower X2 values in the boxes.
Clicking on the boxes in the lower right corner enable you to chose to create a gate on this sample, gate next sample, or gate all samples using these Chi X2 values for the remaining samples.
