Population Comparison
Multivariate Population Comparison
Start by clicking on the population to analyze (the test population) and selecting the Population Comparison Platform from the Platform menu.
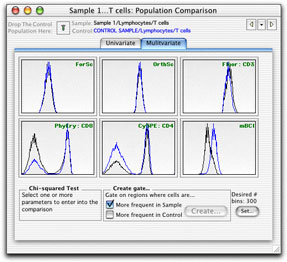
In order to compare multiple parameters, click on the "Multivariate" tab.
As described for the Univariate comparison, you define the control sample or population by dragging it from the workspace window to the box in the top left corner of the window. (Or by dragging the control population onto the comparison icon in the workspace.) (Defining Controls).
Click on the parameters that you want to compare (they will become shaded).
Click a yellow arrow to cycle through samples
Click on the black disclosure triangle between the arrows to select a sample.
The number of bins can be set* according to the number of events collected.
A gate based on the differences between the two samples can be created by clicking Create. Click here for information on the Gate Cut-off and setting the X2 threshold.
The Chi Squared Test divides the control sample into bins with the same number of events, divides the test sample along the same boundaries and calculates the Chi Square of the two binned data sets. The X2 is converted into a metric (T(X)) that can be used to estimate the probability that a test population is different from a control population. See the Population Comparison Overview page for a complete explanation of this statistic.
When T(X) = 0, the two populations are indistinguishable (p = 0.5) and when T(X) = 1, the populations differ by one standard deviation, giving the probability that the two populations differ p < 0.17. A value T(X) > 4 implies that the two distributions are different with a p < 0.01 (99% confidence). However, the minimum value of T(X) that has biological significance depends on the nature of the data being analyzed and therefore needs to be determined empirically. Only populations which have T(X) values larger than this empirical minimum can be considered to be different.
Several populations can be compared in order to determine the minimum T(X) value. Machine stability during the collection, as well as inherent variability in the FACS data are just two reasons why the comparison of a population to itself can give a T(X) > 0. You can compare a population to itself by opening the Population Comparison platform on a sample and dragging the same sample to the control box. FlowJo compares the two halves of this population (one half made up of every other cell while the other half is made up of the cells in between). You can also compare the same sample collected twice (at the beginning and end of the sample collection best determines the machine stability). One could also compare several different samples that have been treated with the same stimulation.
* The number of bins that the test and control sample are divided into should be maximized to most easily detect small differences between populations; however, the number of bins can become limiting for this statistic (depending on the number of events collected and the number of parameters compared). Therefore, a reasonable number of bins is roughly 10% of the event count - leading to a minimum of about 10 events per bin.
As the number of parameters being compared increases, then more events may need to be collected in order to distinguish subtle variations in the populations. However, inclusion of parameters in the comparison which do not vary between populations does not degrade the ability to distinguish the populations.
Note that the computations in the Multivariate Population Comparison platform can be time and memory intensive. You may need to allocate more memory to FlowJo (more information on memory requirements).
As with all other platforms in FlowJo, the Population Comparison Node can be applied to groups of samples by dragging.
The PB Difference population can be viewed (double click to open the graph). Note that the parent population cannot be viewed because it is based on multi-dimensional bins.