
Population Comparison
Univariate Population Comparison
Start by clicking on the population to analyze (the test population) and selecting the Population Comparison platform from the Workspace menu.
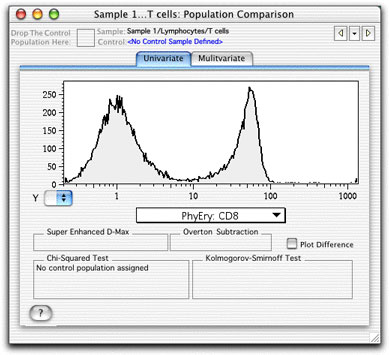
This brings up the Population Comparison platform.
Select a parameter to analyze on the X-axis.
To define the control sample or population, drag it from the workspace window and deposit it in the box in the top left hand corner of the platform's window. (Defining Controls).
Click a yellow arrow to cycle through samples.
Click the black disclosure triangle between the arrows to select a sample.
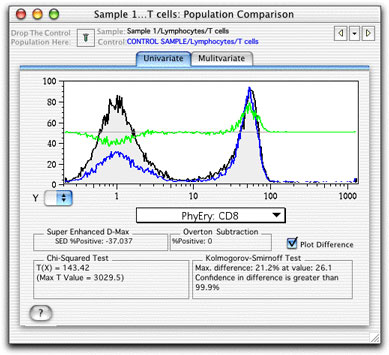
Check the Plot Difference box to superimpose a plot (green line) of the difference between the test and control populations on the histogram.
For any channels in which the test sample has a greater portion of the events, the green line will be above the midline and visa versa. (Note that it will be scaled independently of the histogram).
The Super-enhanced Dmax Subtraction and Overton Subtraction provide the percentage of events that are positive compared to the control. The K-S statistic states a confidence interval for the assertion that the two populations are NOT drawn from a common distribution.
The Chi Squared Test divides the control sample into bins with the same number of events, divides the test sample along the same boundaries and calculates the Chi Square of the two binned data sets. The X2 is converted into a metric (T(X)) that can be used to estimate the probability that a test population is different from a control population. See the Population Comparison Overview page for a complete explanation of these statistics.
When T(X) = 0, the two histograms are indistinguishable (p = 0.5) and when T(X) = 1, the populations differ by one standard deviation, giving the probability that the two populations differ p < 0.17. A value T(X) > 4 implies that the two distributions are different with a p < 0.01 (99% confidence). However, the minimum value of T(X) that has biological significance depends on the nature of the data being analyzed and therefore needs to be determined empirically. Only populations which have T(X) values larger than this empirical minimum can be considered to be different.
Several populations can be compared in order to determine the minimum T(X) value because machine stability during the collection, as well as inherent variability in the FACS data are just two reasons why the comparison of a population to itself can give a T(X) > 0. You can compare a population to itself by opening the Population Comparison platform on a sample and dragging the same sample to the control box. FlowJo compares the two halves of this population (one half made up of every other cell while the other half is made up of the cells in between). You can also compare the same sample collected twice (at the beginning and end of the sample collection best determines the machine stability). You can also compare several different samples that have been treated with the same stimulation.
As with all other platforms in FlowJo, the Population Comparison Node can be applied to groups of samples by dragging.