Cell Cycle
FlowJo provides a simple interface to performing fairly sophisticated DNA/Cell Cycle analysis. To launch the Cell Cycle platform, select any sample or gated population (i.e., where you have gated out debris or gated for a desired phenotype), and choose "Cell Cycle..." from the "Workspace" menu. FlowJo brings up a graph window that is specially designed for cell cycle analyses. You might want to visit the page giving hints for Cell Cycle analysis with FlowJo.
FlowJo tries to determine which parameter contains the DNA quantitation information; if it chooses the wrong one, select the correct one from the X-axis popup menu. Then click on the button "Add/Change Models" to begin your Cell Cycle analysis.
When you click on "Add/Change Models" button, FlowJo shows you the Cell Cycle Specification Window. From this window, you can decide which of several models to compute for the data, and, if necessary, to constrain the fitting parameters by any number of criteria.
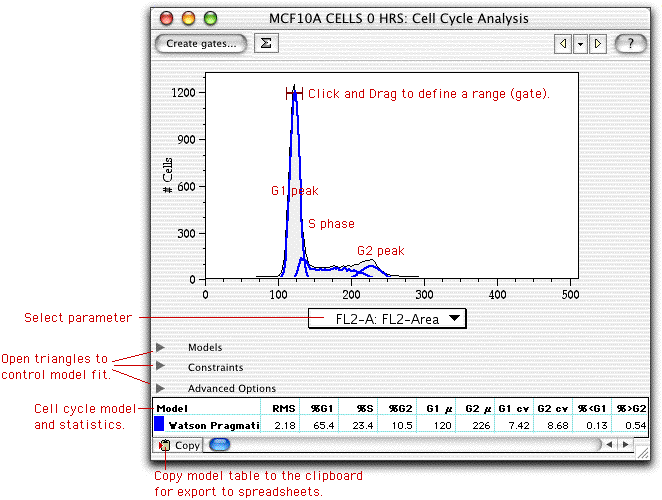
Once FlowJo has computed the model, it displays the fit along with statistical data in the Cell Cycle window, such as that shown below.

The statistics displayed in the table will depend on which models and options are computed, but all will include basic statistics such as the fraction of cells in G1, S, and G2, the positions of the G1 and G2 peaks (and their widths), and the number of cells below G1 and above G2. In addition, the RMS (root mean square) error of the fit is displayed in the first column. If you change the fitting criteria, you may wish to minimize this value as a way to optimize the fit. If FlowJo fails to fit the model(s) to the data, then it will display "Invalid" in the RMS field. In this case, you will want to help FlowJo fit the data by constraining different parameters. See the "hints" page for ideas on how to proceed.
If you click and drag within the graph window, you can create "ranges". Ranges are similar to histogram gates, and can be used by the fitting criteria to constrain peak positions to within the range. In the example above, a range was defined around the G1 peak in order to help FlowJo determine the optimal fit: in the Graph Specification Window, the fit was constrained such that the G1 peak must be found within the defined range.
Cell cycle analyses can be copied between subsets and between samples, and even to groups, just like every other analysis in FlowJo. In this fashion, you can compute Cell Cycle analyses on every sample in an experiment. In general, you will begin by analyzing a control sample, and use this control sample to define ranges for G1 and G2. If you have unusual distributions, constraining the fit by these ranges will help FlowJo determine the proper distribution of cells. Once you have defined the ranges and the fit, drag the analysis to other samples (or the group).
You can drag Cell Cycle analyses to the Layout Editor to generate reports that contain the graphs, the models, and the basic statistics (fraction of cells in G1, S, and G2). You can also copy the table of statistics to the clipboard by clicking on the button right above the table--and then paste into any spreadsheet or word processor for further analysis.
To learn more about applying specific models, view the page on Cell Cycle Graph Specification. You may also wish to view the page on hints for performing Cell Cycle analyses.
Download a Cell Cycle Workspace with Demo Data to try out this platform.
