Kinetics Overview
After reading this, you might want to look at the kinetics question/answer page for a quick introduction to kinetics analysis techniques.
Kinetics analyses are performed by selecting a population in the workspace and choosing Kinetics... from the Platform menu. If a gated population is selected, then the kinetics analyses are performed only on the cells that fall within the gated subset.
Kinetics requires that there be a parameter collected with time information; and that this parameter is named "Time". If FlowJo doesn't find a time parameter, then it asks if you would like to create a derived parameter that corresponds to time. In this case, FlowJo will assume that there was a constant event rate during collection. The time parameter is created via the Derive Parameters dialog, which you can also select directly from the Platform menu. Once you have defined the Time parameter, you can continue.
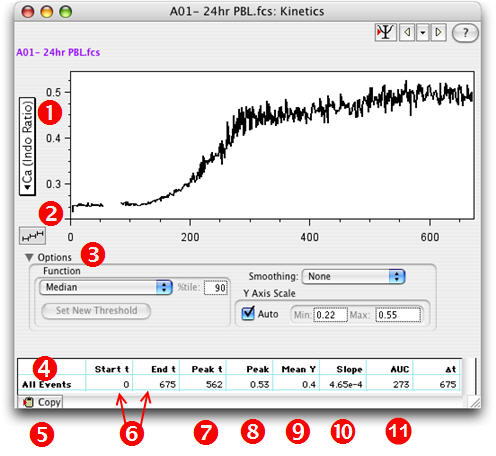
FlowJo begins kinetics analysis by showing the graph window for kinetics analyses, as shown below. This window shows the information and controls associated with kinetics analyses.

- Click this vertical button to choose a parameter to analyze vs. time.
- This button lets you create multiple time slices (see below) in one step.
- Choose a function to be applied to the Y parameter for display. Adjust other parameters of the display. More details here.
- When you create time slices they are displayed here beneath All Events.
- The Copy button copies the tabular data to the clipboard.
- Start time and end time of each time slice.
- The time of peak value within each slice.
- The peak value itself.
- Average value over time slice.
- Linear least-squares within the timeslice.
- Area under the curve.
- The final column contains the elapsed time for each time slice, Delta T.
Since Time is always on the X-axis, you cannot change the X-axis. However, you may select any parameter to be displayed on the Y axis. FlowJo, by default, will display a ratio parameter (if one exists); otherwise, it will choose one of the collected parameters.
The value that is displayed in the line graph is a function of the Y parameter (the name of this function is shown directly above the graph). In this case, the line graph is the 75th percentile of fluorescence for the "Ca" parameter as a function of time. No smoothing has been applied ( a Gaussian smoothing algorithm with a width of 3 seconds or a Moving Average smoothing is available.) And Auto-scaling is on. To change the function of the Y parameter that is displayed, use the Kinetics Options window. Activate this window by opening the triangle beside the word Options (Number 3 in the graphic above.) Refer to the Options page to see what other kinds of functions you can display.Just below the graph is a table of statistics regarding the computed parameter. Each line in the table is a timeslice; by default, the first timeslice is All Events, with a begin and end time that covers the entire collection. The statistics computed for events within a time slice include the peak time and value and the slope of the line within a timeslice. The units for the peak value and the slope are the same as the units shown on the Y axis - linear scaled units for the parameter being displayed. You can copy this information directly to a spreadsheet or word processor: click on the Copy button just below the left edge of the table, and a copy of the table is placed on the Macintosh clipboard. If you switch to a spreadsheet application, select EDIT/PASTE and the table will be copied in to your spreadsheet.
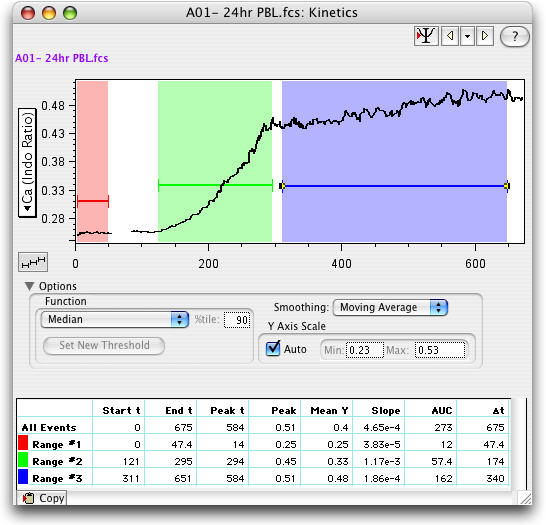
To create a new timeslice, simply click and drag within the graph as you would to create a histogram gate. You will then be asked to name the timeslice; you may also fine-tune the start and end times in the naming dialog window. Shown below is the result of analyzing the graph above: first, the events were smoothed (via the kinetics options); then, three timeslices were defined to cover the background, response, and resolution time periods. Note that the statistics below the graph reflect these new timeslices, and pertain only to the events within the timeslices. If you wish to delete a timeslice, select it by clicking on the darker horizontal line across the time slice, and press the delete key. (Use option-delete to avoid the confirmation query).

Note that the statistics always reflect the smoothed data: thus, by changing the smoothing parameters, you will affect peak time and value. (The slope is generally insensitive to smoothing).
When you select the Copy button from the kinetics window, two different items are placed on the clipboard. One is the graph itself (hold down the option key to include the timeslices as shown in the window). This is what you will see when you subsequently paste into a drawing program. In addition, FlowJo puts the actual kinetics data itself on the clipboard. Note that these values are the smoothed values, if smoothing is selected from the kinetics options .
Kinetics nodes (shown in the workspace with a "t" icon![]() ) behave like other nodes: you can drag & drop them to copy and apply them to other populations. When you copy kinetics analyses
to other nodes (in the workspace), all of the timeslices are copied as well as the specific information regarding smoothing, parameter selection, etc. You can update existing kinetics analyses for other nodes to be similar to one you have just modified
by dragging the newly modified kinetics node onto the original population: FlowJo will ask you whether you want to replace the contents of the existing nodes; select Yes. You can apply kinetics nodes to group nodes to perform batch kinetics
analysis.
) behave like other nodes: you can drag & drop them to copy and apply them to other populations. When you copy kinetics analyses
to other nodes (in the workspace), all of the timeslices are copied as well as the specific information regarding smoothing, parameter selection, etc. You can update existing kinetics analyses for other nodes to be similar to one you have just modified
by dragging the newly modified kinetics node onto the original population: FlowJo will ask you whether you want to replace the contents of the existing nodes; select Yes. You can apply kinetics nodes to group nodes to perform batch kinetics
analysis.
See the Tips page for kinetics analyses.
Download a Kinetics Workspace with Demo Data to try out this platform.
Download the Kinetics Tech Note to print a short (four page) step-by-step guide.
