
Kinetics Graph Specification
When you click the Options disclosure triangle in the kinetics window, you are shown the following options. They modify the attributes of the current graph (or currently-selected gate.)
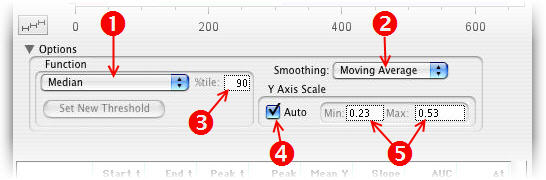
- Select a function for the Y parameter.
- Select a smoothing function.
- For percentile functions, select the percentile value here.
- If checked, graph axes are scaled to the data.
- If Auto is not checked, enter Y Axis limits here.
The functions that can be displayed are each calculated on the Y parameter for each time interval across the entire graph. FlowJo selects an appropriate time interval over which to calculate the function values (usually, this value is 1 channel of the time parameter). After the function is computed, any smoothing that has been selected is applied; the result is graphed in the window. The Y axis scaling is also defined in this window: either automatic (FlowJo scales the Y axis so that the minimum and maximum values of the graph will be onscale) or, you can set the minimum and maximum Y axis values manually.
The possible functions that can be displayed are:
- Median: the median fluorescence of the events in each time interval.
- Mean: the mean fluorescence of the events in each time interval.
- Geometric mean: Same as mean for linear Y parameters; otherwise, it is average of the channel values converted to the scale of the Y parameter.
- Percentile: An arbitrary percentile of the events in each time interval. Entering 50 in the percentile value generates the same graph as Median.
The remaining functions in the drop-down list are computed based on a threshold value. The threshold is a scale value of the Y axis parameter (i.e., not the channel value, but the scaled linear fluorescence value). The threshold can either be an absolute value, or a relative value based on time slices that you have defined (see information on defining thresholds).
The first threshold function is just the fraction of events that are above the threshold for each time interval. If you were to define a certain threshold fluorescence value as the minimum for a cell to be considered a "responding" cell, then the resulting graph would show you the fraction of cells responding as a function of time. Each of the other functions gives you the appropriate statistic calculated only on the cells above the threshold value. Thus, you could, for example, plot the median fluorescence of responding cells to eliminate the averaging in of non-responding cells.
The two possible smoothing functions are Moving Average and Gaussian. They are similar; the Gaussian smoothing places less weight on values more distant from the center. The smoothing width defines approximately how many time intervals are averaged for each displayed time interval; a smoothing width of 1 implies 3 time intervals are averaged for each point.
Go to the overview of Kinetics.