Proliferation
Using flow cytometry to track cell generations is now possible, thanks to the introduction of cell tracking dyes. FlowJo presents a graphical display and a table of data on each generation in the subset. This will provide you with information about how many cell divisions have occurred. In addition the FlowJo Proliferation Platform draws gates in order to separate each generation.
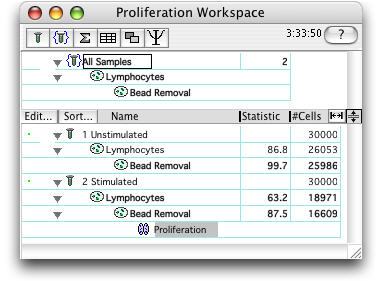
Start by clicking on the population to analyze and selecting Proliferation from the Platform menu.
This brings up the Proliferation Platform.
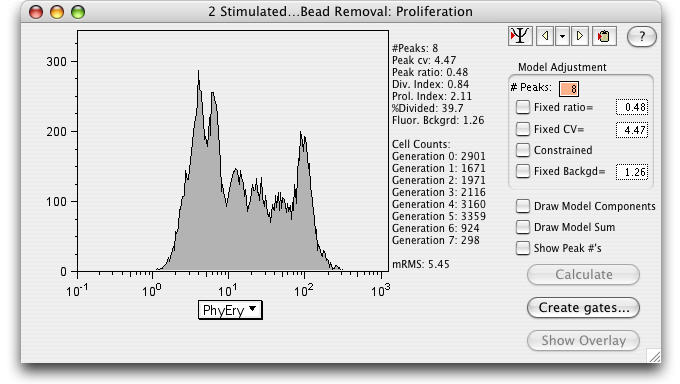
Select a parameter on the X-axis.
The default number of peaks is 8, although it is important that the chosen number of peaks exceed the actual number of peaks in the data.
It is useful to initially calculate the model without constraints (adding constraints as necessary to obtain the best fit).
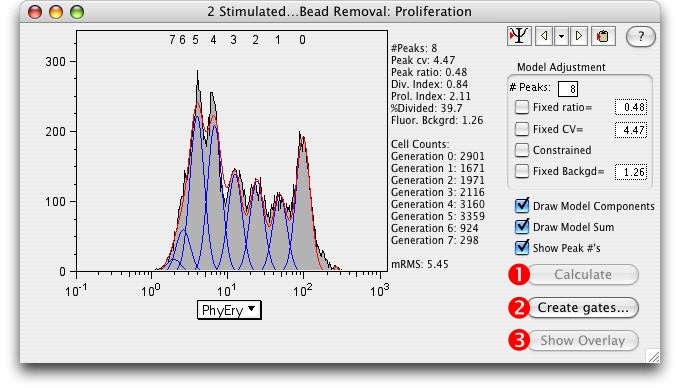
1) Calculate the model by clicking on the Calculate button.
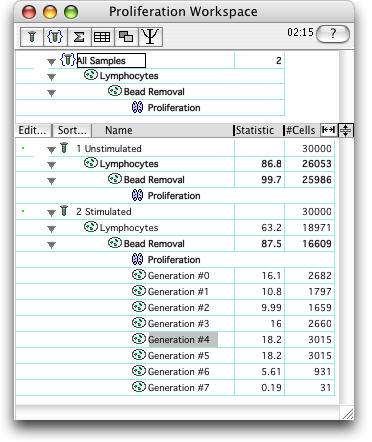
Click a yellow arrow to cycle through samples.
Click the black triangle to select a sample.
Click the clipboard icon to copy table to clipboard.
The Division Index*, Proliferation Index*, and the %Divided* are explained below.
The better the model fit, the lower the Root Mean Square (RMS).
2) Create Gates...Gates dividing the generations can be created by clicking the Create Gates button. (Draws a gate halfway between each peak and adds them to the Workspace.)
3) Show Overlay: Select this button to open the Multigraph Overlay window showing each generation's gate displayed on a bivariate plot with the parameters of your choice.
Proliferation Statistics Defined
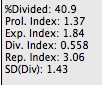
Division Index is the average number of cell divisions that a cell in the original population has undergone. This is an average even for cells which never divided (i.e., includes the undivided peak).
Proliferation Index is the total number of divisions divided by the the number of cells that went into division. The proliferation index only takes into account the cells that underwent at least one division, that is, only responding cells are reflected in the proliferation index. This is probably a more useful value to compare from sample to sample, as it considers only the fraction of responding cells.
The proliferation index more faithfully reflects what the biology of the responding system is; the division index reflects what the entire system is doing.
Another way to think about it - between the two, whichever value is smaller is the average number of divisions of all cells (including nonresponders); the larger value is therefore the average number of divisions for the responding population.
Expansion Index (Exp. Index) - determines the fold-expansion of the overall culture.
For example, if one million cells were stimulated, and EI is 3.0, then the resulting cell count at the end of the culture is three million.
This statistic is therefore identical to that obtained by manual cell counting, and is predicted to be closely related to a 3H-T assay of the culture.
Replication Index(Rep. Index) - determines the fold-expansion of only the responding cells.
This reports the expansion capability of the replicating cells rather than for the entire culture (which is the Exp. Index).
SD (Div) - the variance of PI. It defines how much variability there is in the proliferative capacity of cells in the starting culture. It is more difficult to assign a direct biological meaning to this parameter, and therefore perhaps less useful to report on a routine basis. It can be thought of as a measure of how tightly-regulated the proliferation process will be, after the responding cells have been stimulated.
%Divided�is the same as the Precursor frequency.
Peak CV�is the coefficient of variation for the peaks.� The same value of CV is modeled for all peaks.� Typically, this value is 4-7%.
Peak ratio�is the ratio of fluorescence between subsequent peaks.� i.e., 0.5 implies that peak "n" has half as much fluorescence as peak "n - 1".� Values > 0.5 are not biologically meaningful, and usually arise when the log amp is not very good.� The value should be close to 0.5.
�
As an example of how Proliferation Index and Division Index would be calculated, consider the following:
G0 = 15888 G1 = 32922 G2 = 13647 G3 = 897
The number of cells at start of culture: 15888 + (32922/2) + (13647/4) + (897/8) = 35872.875
The total number of divisions: (32922/2)*1 + (13647/4)*2 + (897/8)*3 = 23620.875
The number of cells that went into division: 35872.875 - 15888 = 19984.875
Division Index: 23620.875 / 35872.875 = 0.66
Proliferation Index: 23620.875 / 19984.875 = 1.18
�
The Model Parameter Adjustments can be used to obtain a better fitting model.
As with all other platforms in FlowJo, the Proliferation Node can be applied to groups of samples by dragging.
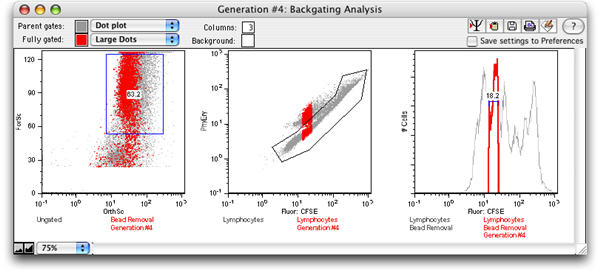
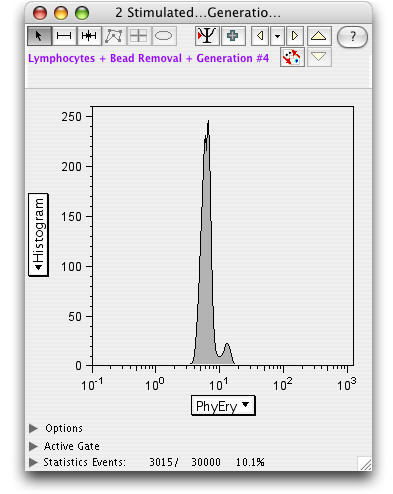
Each generation can be analyzed separately (double click the generation number to open a graph).
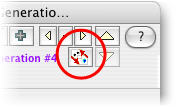
Select the Backgate icon to display a backgating analysis of the generation.