
Layout Controls
In many ways, the Layout Editor is a like a simple page layout program. It can draw boxes and lines, type text and move the items around with a familiar interface. It has some additional aspects as well: it supports multiple pages each with its own layout defined; it has controls to apply the same layout commands to many different datafiles; and most importantly, it has the ability to reference live data in the workspace so that graphs are updated when the underlying gating hierarchy changes.
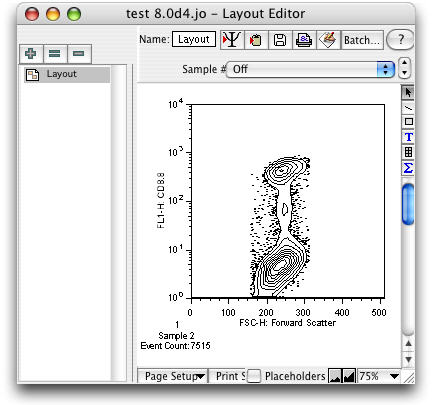
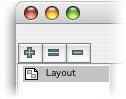
Use the layout editor to create a new layout definition. A layout definition is not the output data itself. Instead it is the specification of which graphs will be placed at what locations, when the layout graphic is generated. Graphs, gates and statistics will continue to be updated in the Layout editor until your analysis is complete. You can have as many layout definitions in the workspace as you wish. You can create new empty definitions or delete them using the buttons in the top left corner of the window. The Plus sign opens a new blank layout, the Equals sign opens a copy of the current layout, the Minus sign deletes the currently visible layout.
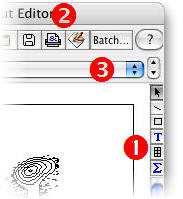
This window has a large number of controls, which are organized in groups. At right is an enlargement of the top right corner of the layout window, showing the groups of buttons in the window. Clicking on on the red numbers will scroll you to the section of this page that describes that group of controls.
Tool Palette
Tucked into the top of the vertical scroll bar is a miniature tool palette, Number One at the right. It contains an Arrow tool, a Line tool, a Rectangle tool, a Text tool, a Grid creation tool, and a Statistics Table tool. Only one tool is active at a time, and the active tool will return to the arrow after any new object is created.
The Arrow Tool

The Arrow Tool is used to select existing objects. Click on an object to select it (as shown by dark handles at the corners of the object). Use the shift key to select additional items. Drag items to move them. Option-drag to duplicate them. Start a drag in the background of the layout editor, and it will draw out a rectangle. Upon finishing the drag, the layout editor will select all objects that are enclosed by that rectangle. (Marquee selection.)
The Rectangle tool

The Rectangle tool is used for drawing simple boxes and frames. If you create the rectangle surrounding another element, and want it to serve as a background, use the Layouts > Send To Back menu command to change the order of the layout. Double click on the rectangle or use the Get Info command from the Layout menu to edit the properties of the rectangle.
The Line tool

The Line Tool is used for drawing lines and arrows. Generally, you will want lines drawn on top of other elements, so draw them last or use the Layouts > Bring To Front command to change the order of the layout. Double click on the line or use the Layouts > Get Info command to edit its properties. Properties supported for lines include which end has an arrowhead, line weight, and dashing pattern.
The Text Tool

The Text Tool is used for adding textual annotation to the layout. To create a text box, you select the text tool from the tool bar, and click once or drag out a rectangle in the layout view. When you create a new text box, a dialog will appear to help you edit the text. This is called the FJML Editor. FlowJo uses a custom markup language, not unlike the HTML used in web pages, to richly express the structure of your flow analysis. Once you confirm changes via the mouse or the Enter key, or click the mouse on a different object in the layout, the editing stops, and the layout editor text is reformatted and frozen. To edit it again, double click on the text box to return it to the edit state. Text clippings or statistics from the workspace can be dragged and dropped into a layout. In both of those cases, a text box is created automatically.
The Grid Tool
The Grid Tool will create a matrix of cells within your layout. Each cell may contain text, charts, images, or other grids. The grids provides a convenient mechanism to group and align multiple elements of the layout. Grids are explained in greater detail on the Grid Tool page.
The Statistics Table Tool

Now you can build a table of statistics within the Layout editor. Click the Sigma button in the Layout editor's tool palette. Drag a rectangle in the area where you want your statistical table to appear. The following dialog opens within which you can construct your table.
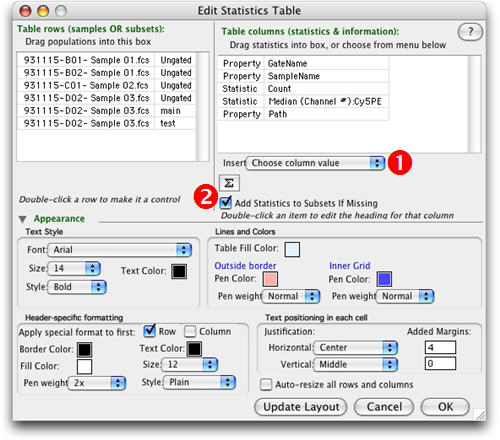
Drag-and-drop samples or subpopulations from the Workspace into the upper left box. This list will label the rows of your new table. Drag-and-drop statistics or other information into the upper right box. These will label the columns of your table. When you click the Update Layout button, your table will appear in the Layout editor with the calculations in place.
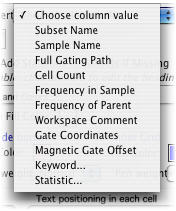
Use the Choose Column Value (Number One above) drop-down list to add columns that don't appear in the current layout. Possible values are shown at right.
Click the Sigma button (Number Two above) to add a new statistic just as you might do in the Workspace. Use the checkbox Add Statistics to Subsets If Missing (also next to the Two) to tell FlowJo to calculate the statistical values for populations in the new table that have not yet been calculated in the Workspace.
Opening the disclosure triangle labeled Appearance shows the usual tools for controlling the style of the text and boxes in the new table.
Click Update Layout to view your changes in the Layout Editor, click OK to accept the current choices and close the Edit Statistics Table dialog box.
Inserting Pictures
You can add graphics from other sources into FlowJo layouts. If the graphic is in PICT format (a Mac standard) then insert graphics simply by pasting them from the clipboard. To include GIF, JPEG or TIFF files, use the Insert Picture... command in the Layout menu. This is a way to include institution or laboratory logos or backgrounds from other sources into your FlowJo layouts. Like boxes and arrows, the pictures are replicated in each frame of an iteration.
Direct Output Commands
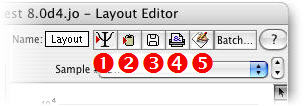
Across the top of the layout window are five buttons, describing the functions of adding data to your SciBook, copying to the clipboard, saving to disk, printing, and launching another program.
The SciBook button, Number One, will copy the current layout and place it on a page of the SciBook. For more information on using the SciBook to collect information pertinent to the current experiment, click here.
The Copy command, Number Two, puts the layout onto the Clipboard, and from which it can be transferred to your favorite graphics package. Note that certain settings of FlowJo can cause it to make a picture where every dot in a dot plot is a separate element in the picture. In particularly large files, this has been know to overtax other programs' ability to paste the contents of the clipboard. If you are having trouble pasting pictures copied from FlowJo, you should go to the Preferences and turn off the setting Export Graphics as Vectors under the General Tab.
The Save operation, Number Three, will create a graphics file of the current layout at its current iteration value. Depending on the setting in the Export preferences dialog, this may be written as a standard Macintosh PICT file, or a GIF, TIFF or JPEG file for special purpose exports. The PICT file is the recommended format, as it contains additional grouping information that can be useful in further editing. PICT files are readable by virtually all graphics programs on the Macintosh, and most of the popular Windows editing packages.
The Print button, Number Four, will cause the current version of the layout to be sent to your chosen printer. If you want to print the current layout from several different values or samples, you should use the Batch button and choose one of three options, Direct to Printer, Preview or New Layout. The second option builds a tiled report which you can then print. The third option builds a report in the style of a layout (i.e., it is fully editable) which can be printed after adjusting the page breaks.
The Launch Helper Application function, Number Five, will activate your favorite graphic program and transfer the data to it. To do this, FlowJo must save the data as a file, so the first thing you will see is a request for a file name and location. Once you have saved the file, FlowJo will attempt to transfer control to the application you have listed in the bottom of the Layout Preferences dialog. If you have not set a preference for graphic or spreadsheet helper applications, a dialog will open that directs you to choose one.
Iteration Controls
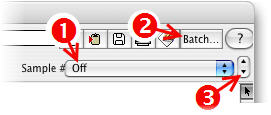
Across the top right corner of the window, near the Direct Output controls, is a row of controls used to change the sample or samples currently viewed in layout. It is easy to take a layout viewing one of your samples and its associated gates and statistics, and see the same displays applied to other data.
The largest and leftmost control, Number One , is a pop-up menu containing all values of the current attribute that exist in the current group. If the current attribute is sample identifier, the label next to the popup is Sample #, and all of the samples in the current group will be listed in the menu. If another keyword has been set to be the iteration attribute via the Iteration Options. dialog, then all values of that attribute will be listed. In a patient study, this may be a patient id, a date or therapy for which multiple samples have been drawn and collected.
The Batch button, Number Two, is the Iterate command button. Pressing this will take you to FlowJo's Make Batch Report... dialog. It will prompt you to choose from one of four report types: making a new layout, preview (tiled report), web page with graphic, or Quicktime movie. In addition, you can choose to directly print the layout.
The rightmost control, Number Three , the Up and Down Buttons, will reset the iteration attribute to its next or previous value. This is convenient for quickly looking through multiple layouts, without generating the entire set of them. You can also use the page up and page down keys to move through the iteration.
Page Setup And Magnification
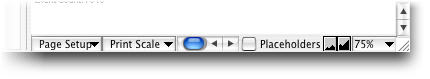
At the bottom of the layout window are additional controls that govern the scaling of the layout, either on the printed page (Page Setup) or on the screen. The Page Setup button will bring up the Mac's standard Page Setup dialog, allowing you to set options such as the printer defaults, the paper size, the paper orientation and the scaling. You will notice that the layout editor draws light gray lines signifying where the page breaks would be if you were to print the layout. Changing the Page Setup options will generally cause the page breaks to be redrawn to reflect the new page size and scale. In addition to changing the scaling from the Page Setup dialog, you can also place the mouse over the intersection of any of the gray pagination lines in the layout and rescale the magnification just by dragging the page size larger and smaller.
The page size can also be changed automatically using the Print Scale popup menu or manually by dragging the corners of the page outlines in the layout editor. The Print Scale popup will provide commands to Scale to Page Width or Scale To Page Height. These will measure the size of the layout, and then rescale the page to make the desired dimension fit. The option Scale to Page chooses between Scale to Page Width and Scale To Page Height, finding the option that leaves the images as large as possible, while still fitting them on the page.
Those settings set the way the layout is scaled to fit the printed page. The settings on the right side of the control strip govern how the layout is scaled to be displayed on the screen. The smaller buttons showing distant and closer mountains zoom in and out, that is, they reduce and increase the magnification within the layout window. The popup menu allows you to set the magnification directly. Scales from 12.5% to 200% of the original size are available. The keyboard commands Cmd-[ and Cmd-] will also zoom in and out, respectively.
The Use Placeholders button is discussed later in its own page.