Adding Statistics
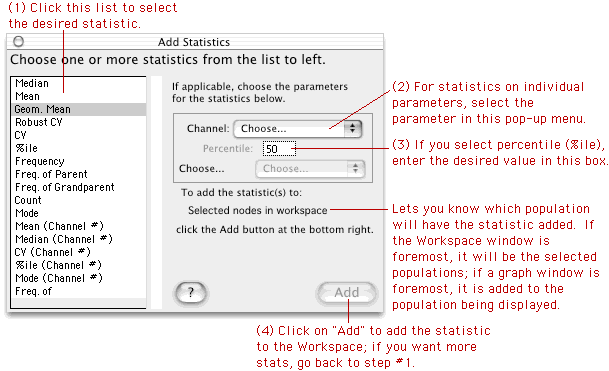
![]() Shown below is the statistics definitions window. This window appears when you select the Statistics button in the workspace window, the graph window or in the Layout editor when you click the table tool. The statistic that will be computed is added to whatever subpopulations are currently selected (workspace window)
or displayed (in the graph window).� Select multiple populations in the workspace to add the same statistics to all of them at once.
Shown below is the statistics definitions window. This window appears when you select the Statistics button in the workspace window, the graph window or in the Layout editor when you click the table tool. The statistic that will be computed is added to whatever subpopulations are currently selected (workspace window)
or displayed (in the graph window).� Select multiple populations in the workspace to add the same statistics to all of them at once.
Adding statistics to a population is performed in up to four steps, as shown below. Add all of the different statistics to a single sample at once by repeating steps 1-4 for each statistic.
 �
�
Once you have added statistics to a node, the easiest way to compute these statistics for other samples or subpopulations is to drag the nodes and drop them onto the desired destination.� You may also drag statistic nodes into the Layout Editor to create a text box with the statistic value, that is updated whenever the statistic itself changes value (for example, in response to your moving a gate).� Statistics are most conveniently collected and exported using the Table Editor. Now you can build a table of statistics within the Layout editor. Click the Sigma button in the Layout editor's tool palette. Drag a rectangle in the area where you want your statistical table to appear. To construct the table, click here.
You may view a complete Definition of these statistics.
