
Print Preview
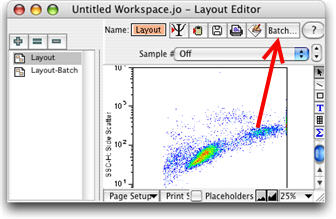
Once you have created a layout in the editor, you can direct FlowJo to produce a batch analysis.� That is, to create the same picture, using each of the samples or values of the iteration attribute in the current group.
Iteration is a process of repeating analyses for all members of a group. Other pages describe it in detail, the current page describes what you can do with the results.
There are several potentially interesting things you might want to do with the results of a batch/iteration process:
- Print it, one layout per page, as a report.�
- Print it at a minimum readable size for summary analysis.
- View it as tiled graphs onscreen.
- View it as a movie onscreen.
- Save a standard Pict file to disk for further processing / publishing.
- Create a Webpage showing all images.
- Create a Webpage displaying the movie.
Print Preview Report
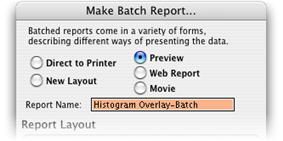
There are several output types for batched reports: a new layout, a movie, a web page, and a Print Preview (tiled) report. In addition, you can directly print a report without first viewing the results of the batching. The Print Preview is used to display a tiled report on your screen.� As the layout editor iterates, it builds a series of frames.� The collection of all the frames is called a stack.�
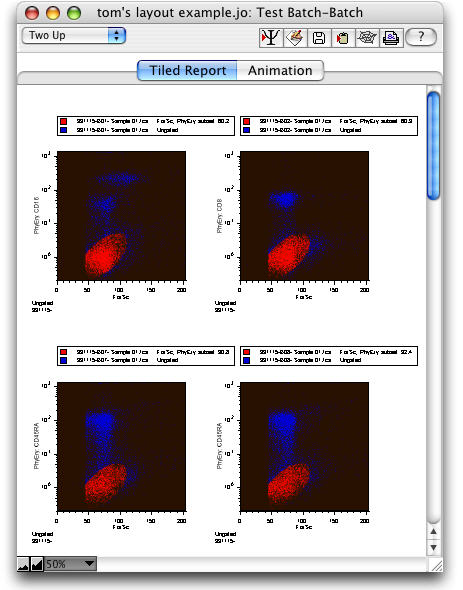
The preview report displays the stack of frames in two different ways:
- Print Preview (Tiled) Frames:� a grid of images that can be printed.
- Animated Frames:� a movie that can quickly display a batch report one page at a time using the QuickTime player.
Both views support output of the graphic display to disk, clipboard, or printer.� These functions can be accessed by main menu commands (under the File menu), the command-key equivalents (command-S, command-C, and command-P, respectively), or by clicking on the appropriate icons near the top right of the Print Preview window.
Below is a screenshot of a Print Preview in Tiled Report mode:
Tiling Options
The tiling pattern on the screen is controlled by the dropdown menu in the upper left. You can choose to lay out your frames by the number of columns you desire. One up, Two up, Three up and Four Up are offered, and should cover most cases. When you click on this button, the final item in the dropdown menu, Custom... will bring up the following dialog containing more options and information.
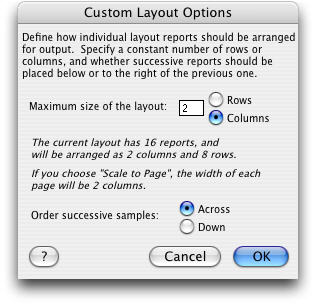
The Custom Layout Options dialog handles special case scenarios where you want to determine the layout from a fixed number of rows instead of a fixed number of columns. It allows you to order the graphs from top to bottom instead of from left to right.
You can enter a value for either rows or columns, and the other dimension will be automatically recalculated to accommodate the number of iterations in your batch.
Order successive samples is a way to determine how the frames are sequenced, as illustrated below.
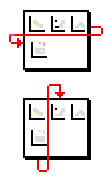
Order Across: Each frame is placed to the right of the one before it, until the number of columns you have chosen is reached, and then a new row is started.
Order Down: Each frame is placed below the one preceding it, until the number of rows you have entered is reached, at which point a new column is started.
Printing
One of the most annoying aspects of large analyses is having to manually piece pages back together because the layout program can't conform to the printer's page breaks. FlowJo avoids these problems by printing a specific number of tiles per page. When you click the printer button from a Tiled report, the Choose Print Layout Options dialog will open and allow you to choose the number of tiles per page and many other printing options.
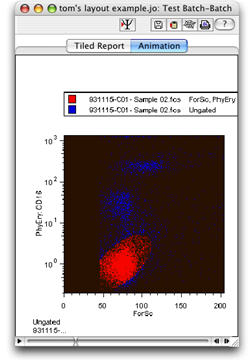
Animated Frames
In addition to having the ability to tile frames for efficient printing (shown above) FlowJo also has a unique tool for visualizing this large accumulation of information. Click the Animation button and each page of your batch will become a frame in a QuickTime movie.
The human eye and brain are better suited for finding patterns changing through time than they are in juxtaposing patterns in a two dimensional grid, or in constructing them in a three dimensional space. If you are searching through a large number of samples looking for patterns, similarities or trends, this animated view may give you new insight.
Since the data for the animated frames and tiled frames are based on the same graphs, you can quickly switch between the views without have to recompute extensive numbers of graphs.
Once your movie appears on screen, you can save it to disk or embed it in a Web page. The spider web button at the top of the Print Preview window will create a folder with your Webpage and movie in it.
Across the bottom of this window are the standard controls used to play a quicktime movie.� The leftmost arrow is the play button.� The right side controls move to the previous or next frame in the movie.
There are also keyboard shortcuts for each of these actions: The space bar (or double clicking the frame) will play the movie.� The left and right arrow keys move to previous and next frame.
It is possible to export movies to other Mac programs or web sites by dragging the image from the window to the Finder.� Shift click on the thumb of the scroller to select a subrange for export.
Movies can be generated from any graph in FlowJo, not just from a batch operation. Click for more information on the scope of the Movie tools.