Parameter Movie 1
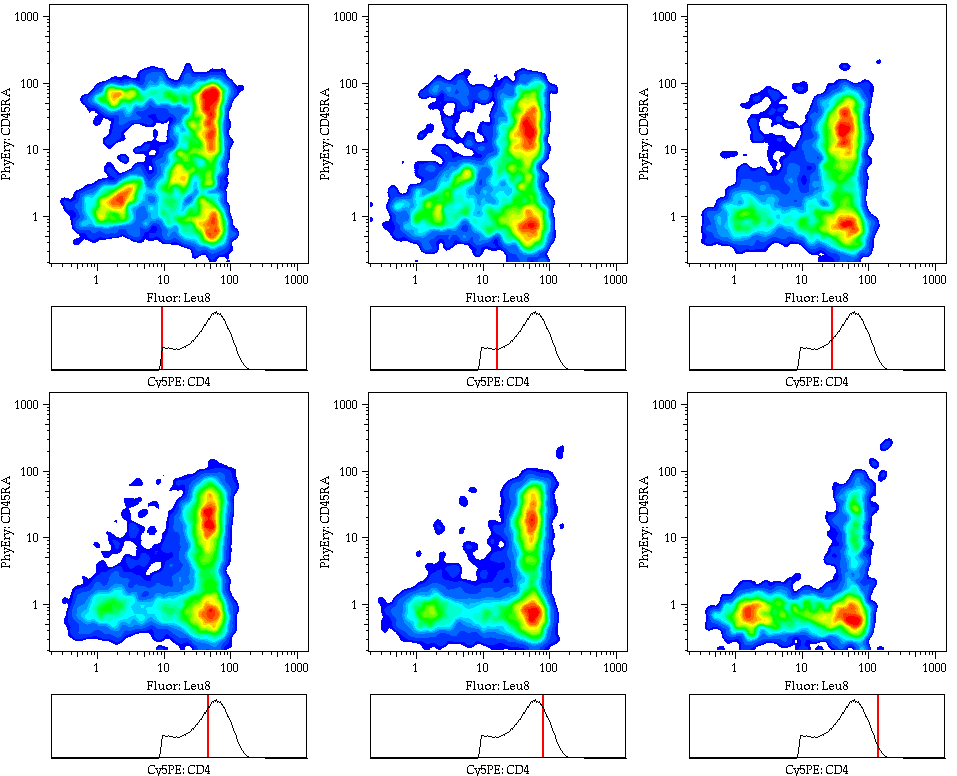
This data is from a 3-color immunophenotyping experiment using CD4, CD45RA, and CD62L (Leu8) to stain human PBMC. The sample was gated for lymphocytes using forward and side scatter, and then for CD4 T cells. A pseudocolor plot of CD45RA vs. CD62L is shown as a function of the CD4 intensity (below).

The bottom graph shows the slice of CD4 intensity that is used to gate the current frame of the movie. For this movie, equal channel size was selected; thus, each frame can have different number of events. (To see how this movie would look with equal event framing, click here.)
You will notice several features about the graph as the CD4 intensity is varied. First, the upper left population (CD45RA+CD62L-) only appears at the very lowest CD4 intensities (this is an activated T cell population that has likely downregulated expression of CD4 itself). As the CD4 intensity increases, you will also note that the amount of CD62L (Leu8) per cell for the CD62L+ cells increases as well.
View the Kinetics sample movie, or go back to the movies overview.
