
The PolyChromatic Plot - Refine Settings
The PolyChromatic Plot uses color to assist in visualizing a sample's staining and intensity. For basic configuration, click here. To learn about the other settings, click the following links, or click on the tool itself.
| Explore Priorities Explore Scaling |
Copy/Paste Settings Revert - Copy to Clipboard |
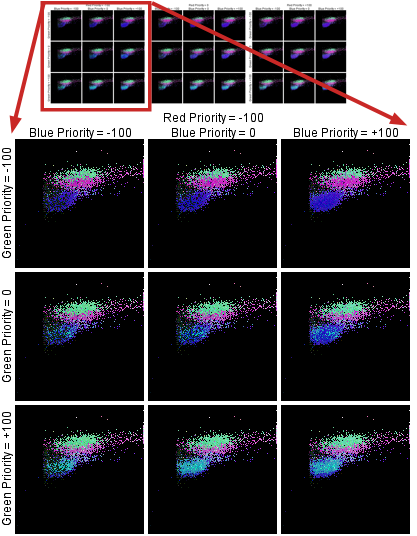
When you are using the PolyChromatic plot, you can open and adjust its settings by clicking the triangular spectrum icon in the Graph window:
![]() Adjustments to the color settings of each plot are independent of the other plots, whether you are working in the Graph window or the Layout editor.
Adjustments to the color settings of each plot are independent of the other plots, whether you are working in the Graph window or the Layout editor.
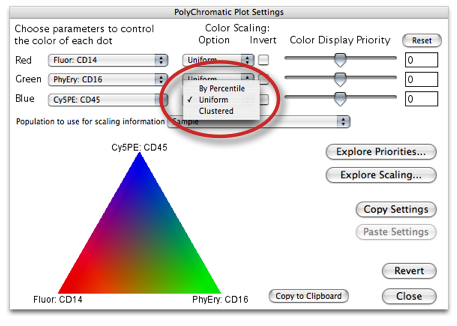
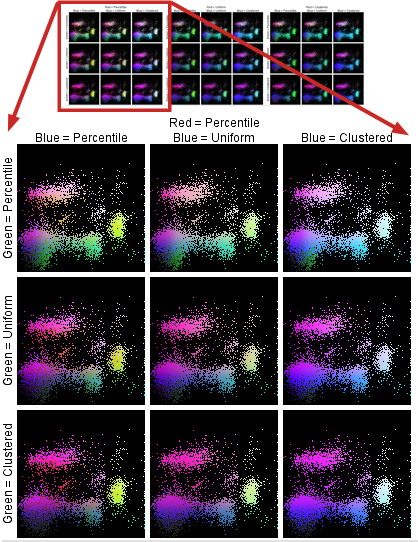
Color Scaling is controlled by three drop-down menus circled above. Scaling is how FlowJo maps fluorescence intensity to color intensity. (You can most easily see this by choosing only one parameter to control color, and changing its Option. The changes are most dramatic when used on a population that is bimodal in the parameter used to control color). Chose Uniform (the default), By Percentile or Clustered.
|
|
|
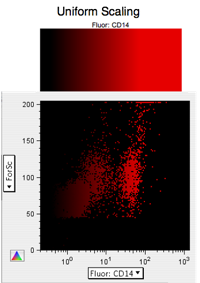
With the Uniform scaling, the color range (Black to Red, for example) scales uniformly as the fluorescence intensity changes from the dimmest to the brightest, irrespective of the actual distribution of events in the reference population (although the reference population will define what is dimmest and what is brightest). So if the dimmest event happens one third of the way across the graph, and the brightest event occurs two thirds of the way across the graph, then the color for the events will scale linearly (black to red) as the intensity varies from the 1/3rd point to the 2/3rds point.
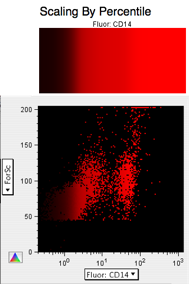
The other scaling choices will change this mapping from a straight line. The Percentile scaling means the intensity (black to red) maps linearly with the percentile of the distribution. Thus, at the median, the color is halfway between black and red; at the 75th percentile, the color is 3/4ths red; at the maximum fluorescence, the color is fully red. This scaling tends to make the color differentiate within a subset -- i.e., if you have a uniform cluster, the color will change as you go across that subset.
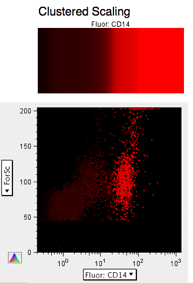
The Clustered scaling does the opposite -- the color intensity changes the fastest between subsets, and tries to remain relatively constant as you go across a population.
Explore Scaling... This button opens a new window with scaling settings displayed in an array. The results of all combinations of Percentile, Uniform and Clustered settings are shown for all three colors. You can double click on any thumbnail in this view to change the original graph to that new combination.
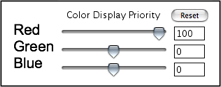
Color Display Priority: this controls how dots are drawn in the dot plot. As you give blue more priority, then dots with more blue color will "float" to the top and be over-emphasized. Likewise, if you give red less priority, those dots with more red color will float down and be hidden. This enables you to reveal rare populations by giving them priority.
Here, each color in turn was set to 100 with the others at 0 (neutral).
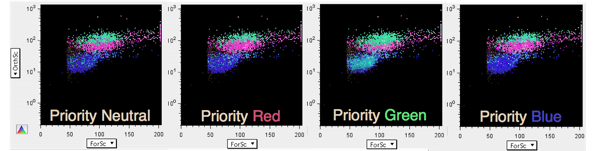
Explore Priorities... This button opens a new window with an array similar to the Explore Scaling array above. All combinations of the three priority settings for three values (-100, 0 and +100) are shown. Like the Scaling array, you can double click any image and transfer those settings to the current graph.
Copy/Paste Settings... You can move the PolyChromatic settings from one sample's graph to another sample with the same staining by clicking Copy Settings then move to another PolyChromatic plot and click Paste Settings.
Revert returns the settings to what they were when you first opened the Settings dialog... or what they were when you changed the graph window to a new population and the Settings tool pointed to this new graph with its existing settings).
Copy to Clipboard puts a copy of the spectrum image on the clipboard, from whence it can be copied into the Layout editor or elsewhere.