
The PolyChromatic Plot
You can use color to assist in visualizing a sample's staining and intensity. For maximum contrast, the example at right has the Background color set to black and the High Resolution box checked.
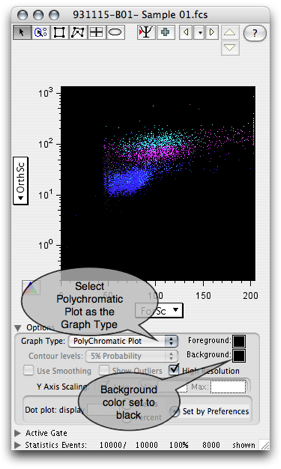
Open a graph window and select PolyChromatic Plot from the Graph type menu in Options. This choice is also available under FlowJo's main Graph menu.
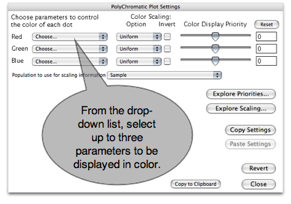
This will open a dialog window shown below, where you can specify which parameters are associated with which colors. Then you can refine the color display to maximize its clarity.
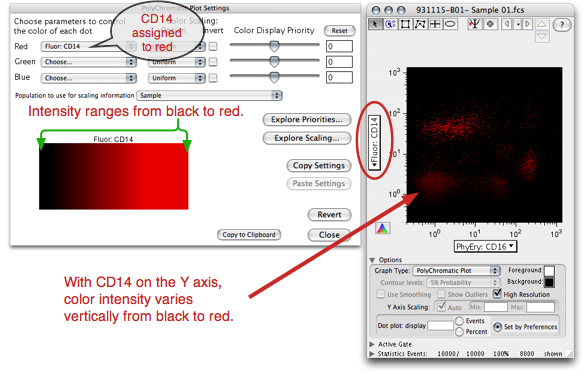
With only the first parameter assigned to a color, the display looks like this:
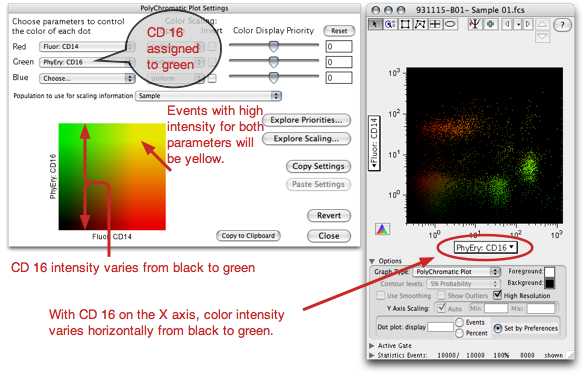
Assign a second parameter to a second color, the color spectrum changes as follows...
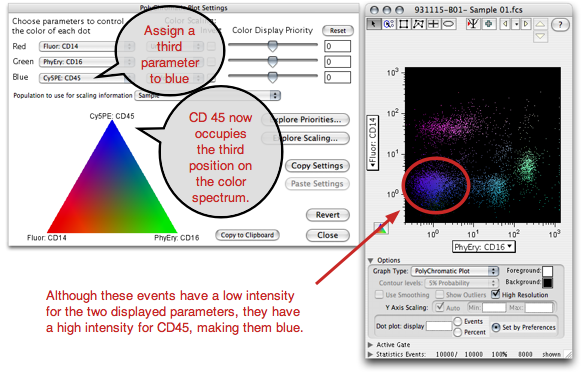
With a third parameter assigned to a color, the display reveals those events by color.
For information on the additional settings, click here.