
Layout Objects
A layout is created by adding objects to a blank canvas. The objects may be rectangles, lines, text or graphs. Once you have placed objects onto the canvas, you can move them (by clicking and dragging one or more selected items), resize them (by clicking and dragging on the "handles" of a selected item), or align them to each other (by selecting "Alignment..." from the "Layout" menu). The Alignment tool is a powerful tool that even lets you put multiple graphs right next to each other (i.e., abutting axes) to create a compressed view!
Rectangles, lines and text can be added via the tool palette, found above the vertical scrollbar on the right edge of the layout window. Select the desired tool, and drag within the editor's view in order to create a new object. [More on Layout Tools]
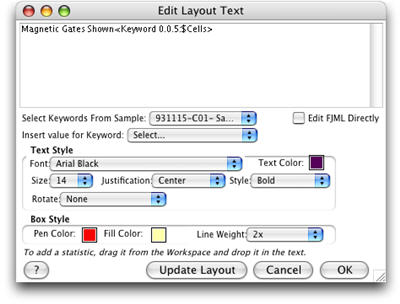
To edit the color, line weight, text styles, or other information about the object, select the object and choose Get Info. from the Layout menu. (As a shortcut, you can also double click on the object.) This will bring up one of the Layout Item Definition dialog boxes, which provides the user interface for editing any of the graphical characteristics of the object. The content of the dialog is dependent on the type of the object. At right is an example of the dialog that comes up when you edit the definition of a text box.
Graph Objects
To add a graph to a layout, drag the node representing the population or sample from the Workspace window and drop it into the layout. This will create a new graph object in the layout editor. As with other objects, you can use the Get Info. command (or a double click) to edit the characteristics of the graph. If you select multiple items in the layout editor (ie, several graphs or a graph and a box...), the multiple items window will allow you to change all attributes at once.
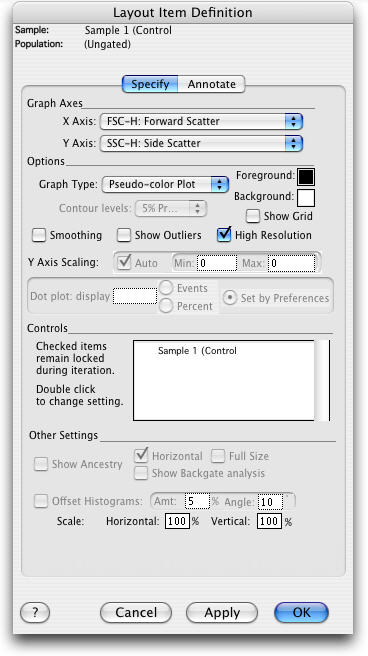
This dialog is devided into two panels, Specify and Annotate. Specify is shown at the left. There are popup menus listing the available X and Y axis parameters, as well as others to set the graph type and the optional parameters that govern the appearance of the resulting plot.
In the case of histograms, it is also possible to fix the minimum and maximum values on the Y axis. This will enable you to prevent the axis from being recalculated for each frame in the layout, and make it easier to compare successive frames of a multi-sample layout.
More description on these items can be found in the Graph Window documentation of the Graph Specification floating palette.
An additional item found in this dialog is the Controls text box. This will let you specify a graph, or layer in an overlay graph, to be a control. Control graphs remain the same while others in the layout are changed as the batch process iterates through the other samples and statistics in the current group. This provides you a way to create layouts that show multiple samples, all compared to an original or control sample.
You can request the graph to Show Ancestry, meaning that all the parent populations and gates used to define this population will be shown as part of this graph. If this option is chosen, then you can also choose whether to show the ancestry horizontally across the top of the graph, or vertically along the left of the main view. You can also choose whether gates that are defined on this population should be shown.
Histogram overlays have the additional option of adding an offset that produces a 3D-like plot of the multiple histograms. This separates the lines and makes it easier to compare several curves on the same graph. Any value between 0 and 100% can be used as the Amount to offset. This puts a distance between the histograms on the Z Axis. The Angle setting rotates the origin of the baseline up and away from the viewer. Values of five to twenty give useful results, but experiment.
The second configuration panel appears when you click Annotate. It governs the additional annotation that (optionally) accompanies a graph in a layout.
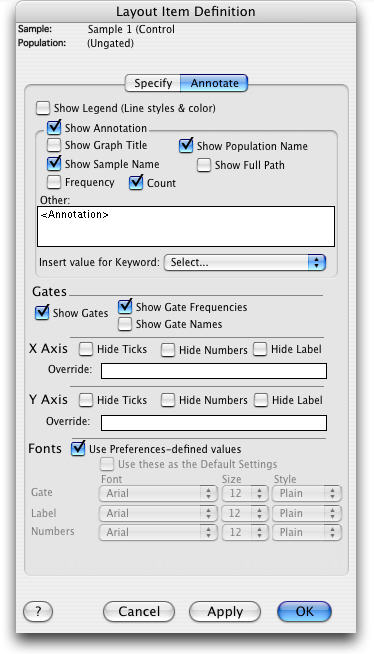
The setting Show Annotation determines whether the annotation is desired at all. If you uncheck this box, FlowJo will not generate a text box associated with this graph. Assuming that it is checked, you can optionally have the annotation include the graph's title, the name of the sample, then name of all the gates leading to this population (the full name or full path), as well as statistics showing the frequency and/or the event count. There is also an additional text box that will let you include any extra information you may want to display in the layout.
There is a setting to Show Legend for a graph. By default legends are only created for overlay graphs, where the color is used to distinguish the different data sets. But because the legend is the means to set the color and line style of histograms and dot plots, it can be useful to override the default and show legends for single data series graphs. Conversersely, there may be times when the legend is not necessary, even with multiple data sets, or you are making your own legend. In those cases, you can tell the layout editor to suppress drawing of any graph's legend.
Other settings available in this dialog include the ability to suppress either axis. This is useful if you are producing a layout with a large number of graphs and you want to save space by compressing the graphs close together and only label the outside axes.
Graphs can be resized in the layouts by dragging any of the corners. The mouse will show the percentage of magnification as you resize. It is also possible to use the dialog to resize graphs to a known size or aspect ratio. Typing the values manually gives more precise control of the scaling.
To navigate between a graph that appears in a layout, and the graph window where its gates are defined, there is a command Open Original Graph in the Layout menu. This opens the Graph Window containing the population selected in the layout. From there it is easy to navigate up the gating hierarchy to see all of the gates that define this population. There are shortcuts for this command:
- from the keyboard: Cmd-R, or
- with the mouse, Option-Cmd-click on the graph.