
Spectral Compensation
Spectral compensation is a process in which fluorescence emissions are collected holistically as spectra; compensation is performed by unmixing the spectrum of each fluorescent probe from the total signal using linear least squares to solve an over-determined system of equations.
Spectral compensation can be calculated and applied to any cytometric data set that contains more detectors than fluorescent probes. The basic premise is that the emission spectrum of each fluorochrome is measured in multiple detectors, using data from all available detectors on the acquisition cytometer, producing as complete a picture of the emission spectrum as possible. As with standard compensation, single stained compensation controls are utilized as exemplars of each individual fluorochrome spectrum, along with an unstained control or internal negative population for background autofluorescence. Using these exemplars, unmixing can determine what portion of collected 'mixed' data was contributed by each fluorochrome. Standard compensation is no different, except that the number of detectors equals the number of fluorochromes.
Creating a Spectral Compensation Matrix
Spectral compensation is accessed from the same compensation wizard that calculates traditional compensation matrices, as shown in Figure 1.
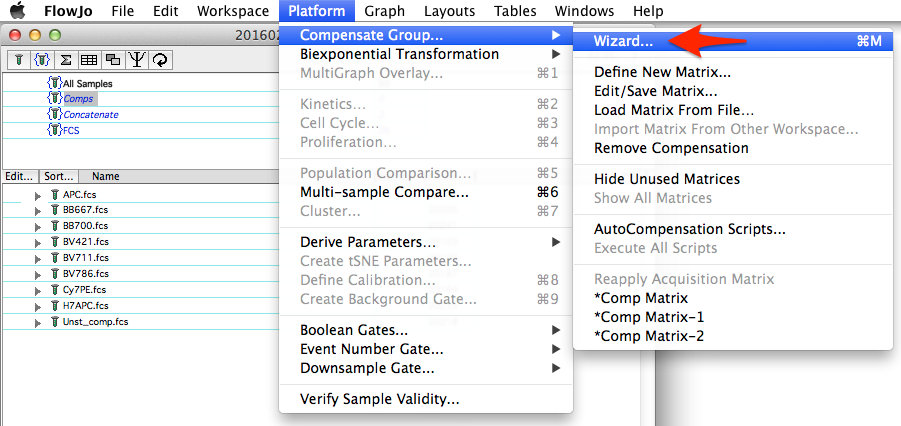
Figure 1: Initiating spectral compensation through the compensation wizard
To select samples for use within the wizard, you can group samples then select the group, highlight samples in the samples pane before selecting the wizard, or drag and drop them from the workspace into the left side pane of the compensation wizard window. Similar to standard compensation, for each compensation control a gated population should be specified as either positive (events stained with the fluorochrome) or negative (unstained control, or internal negative). A normal compensation matrix will be calculated from these selections. To switch to spectral compensation, simply check the 'Spectral' box as shown in Figure 2.
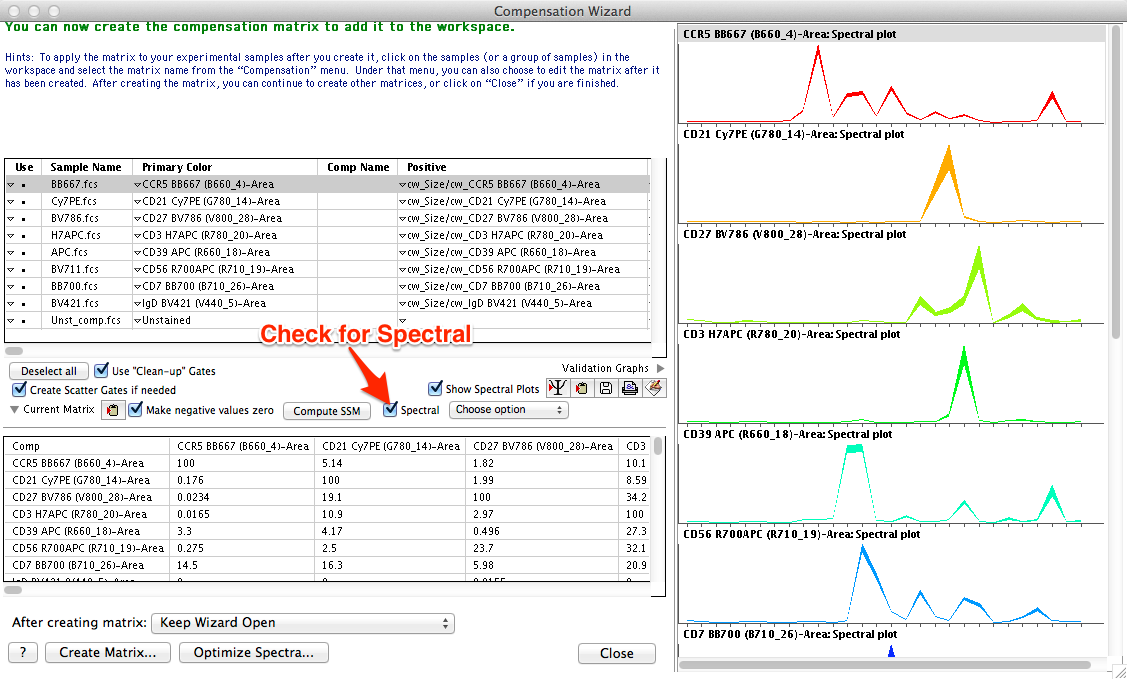
Figure 2: Spectral compensation in FlowJo. Traditional dot plots are replaced with spectrum plots when the 'Spectral' box is checked.
Once the Spectral box is checked, several changes to the user interface will occur:
- The positive and negative gating preview plots on the right-hand portion of the compensation wizard window switch to spectral plots displaying the emission spectrum of each fluorochrome across the entire set of measured detectors. A number of options are available for customizing the display, as shown in Figure 3.
- Choosing 'Show individual spectra' displays the spectrum of each fluorochrome and well as the overlay of all. Deselecting will display only the overlay.
- Choosing 'Line width shows distribution' scales the line width on the spectrum plots according to the range of intensity values collected in each detector. A thicker line indicates more variability in the data distribution. Generally, bead compensation controls will will have less variability than cell compensation controls, and will display as a thinner line.
- Choosing 'Sort by laser then wavelength' orders the display of the detectors so that the spectra are properly ordered across the light spectrum, using laser first then wavelength as sort criteria.
- Choosing 'Sort by wavelength then laser' sorts using wavelength first, then laser. For these options to work, FlowJo assumes the parameter name ($PnN) is annotated as laser then wavelength. (e.g. V510 is interpreted as Violet Laser, wavelength 510.)
- The traditional square compensation matrix (where the number of detectors is equal to the number of compensated parameters) will change into a spectral compensation matrix (number of detectors is greater than the number of compensated parameters). Because there is no longer a one-to-one relationship between detectors and compensated parameters, it would be incorrect to simply name the compensated parameter based on the name of the primary detector for a fluorescent probe. Instead, we will need a unique naming scheme for spectrally compensated parameters representing that the compensated parameter is derived from an entire emission spectrum of the probe measured across all detectors.
- A new column called Comp Name will appear in the list of compensation samples (Figure 4). This column is where users can specify the names of spectrally compensated parameters that will be used for displaying and gating the compensated data. Comp Names can be entered manually, or there is a popup menu providing options for copying the Comp Names from sample names, stain names, or any other user selected keyword, as well as a paste from clipboard function.
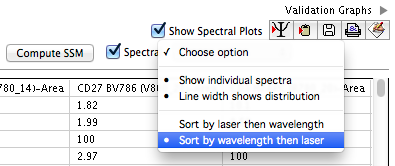
Figure 3: Spectrum display options.
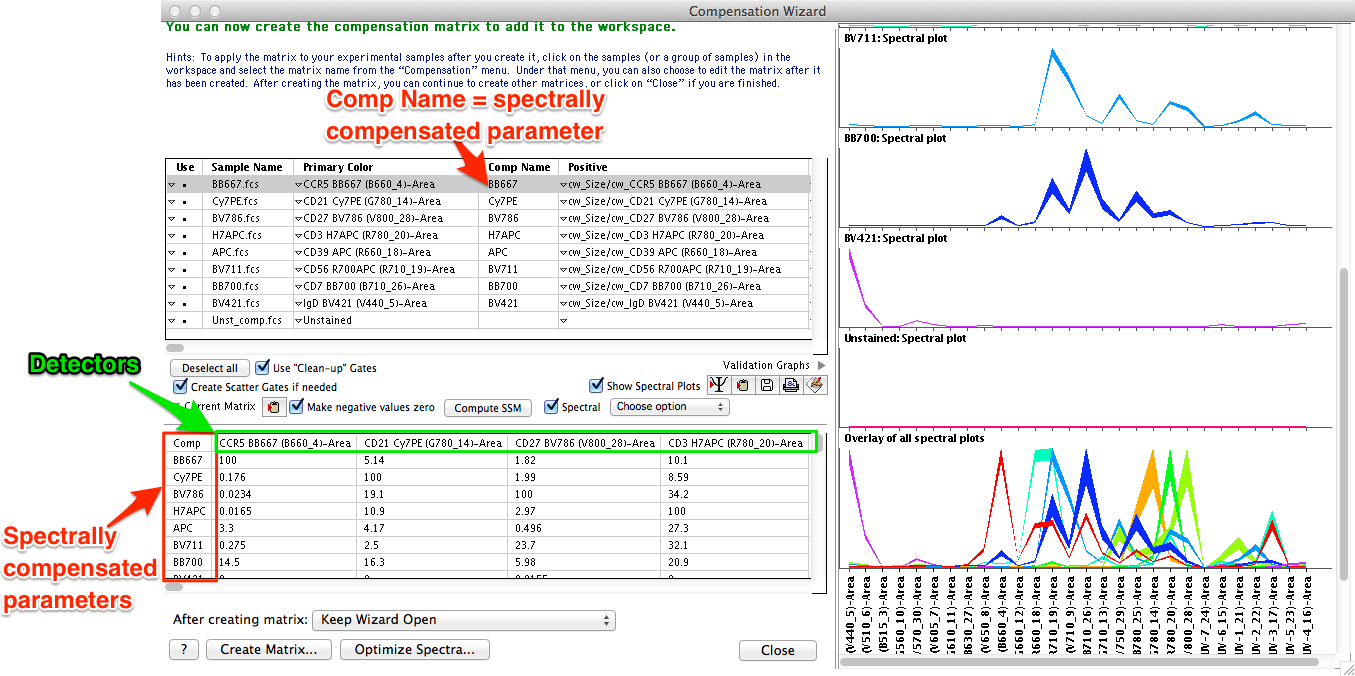
Figure 4: Naming conventions in spectral compensation. Users should specify the desired nomenclature for resulting spectrally compensated parameters in the Comp Name column.
Important Note: Because spectral compensation uses more detectors than probes, there is no longer a one-to-one relationship between uncompensated (mixed) parameters to compensated (unmixed) parameters. The data is this example uses 27 detectors to collect emission spectrum information on each fluorochrome, but a staining panel consisting of 10 fluorescent probes, will only result in 10 compensated parameters. Each spectrally compensated unmixed fluorochrome emission spectrum uses information from all measured detectors, so the compensated parameter should not simply be named by the primary detector name. To accommodate this, FlowJo allows the user to specify the names of spectrally compensated parameters with their own unique nomenclature in the Comp Name column.
Users are urged to be very careful in how they name the spectrally compensated parameters. Come up with a consistent naming scheme and stick to that nomenclature from experiment to experiment. We suggest using the probe fluorochrome name (ex. BV480, FITC, PE, PE-Cy7, etc), as the spectrally compensated parameter name. Remember that gates are applied to parameters, so if a user wants to apply identical gates to samples from different experimental runs, the user-specified Comp Names for resulting spectrally compensated parameters must match exactly.
Once Comp names are specified, spectral compensation can proceed like traditional compensation in FlowJo. The spillover spreading matrix (SSM) can be calculated, the matrix can be created, and it can be applied to any sample or samples by selecting them and choosing the desired matrix from the list of matrices in the workspace under the platforms menu.
Also of note, FlowJo will name all spectral compensation matrices with an asterisk prefix as shown in figure 5.
Figure 5: Matrix naming convention. Spectral compensation matrices always contain an asterisk prefix.
Editing a Spectral Compensation Matrix
Spectral matrices cannot be directly edited. However, compensation between two probes can be increased or decreased with an offset matrix. The offset matrix is accessed through the same Edit/Save Matrix function for to edit traditional compensation matrices. (Platform menu -> Compensate Sample... -> Edit/Save Matrix...). When a spectral compensation matrix is selected from the list (names with an asterisk prefix), the window displays an offset matrix, and users can enter positive or negative numbers to increase or decrease the compensation between two fluorescent probes.
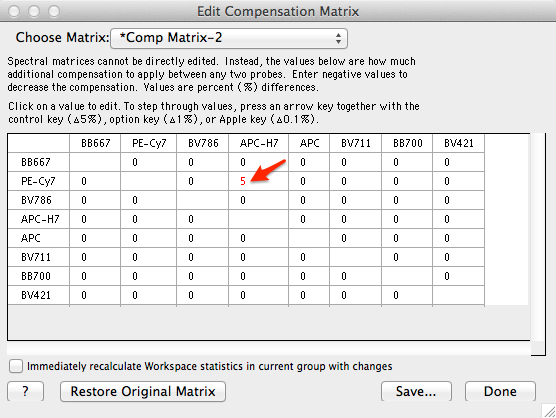
Figure 6: Editing compensation between two probes using an offset matrix.
Optimizing a Spectral Compensation Matrix
If a data set has many more detectors than measured fluorescent probes, Optimize Spectra can be used to improve the distribution of the compensated data (minimizing spillover spreading).
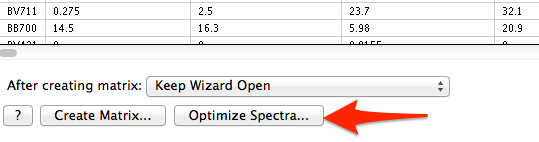
Figure 7: Optimizing spectral compensation.
Optimize Spectra weights the contribution of each detector in the unmixing process and tries to optimize this weighting to minimize the spillover spreading. Detectors that have similar florescence contributions from multiple probes are weighted less than detectors with more discriminatory power. The calculation is non-trivial and may take several minutes to complete, but can reduce spillover spreading on data sets that meet the "more detectors than probes" requirement. If the number of measured detectors is similar to the number of fluorescent probes, then optimization will have little to no effect.