
Statistics Table Tool

Now you can build or edit a table of statistics within the Layout editor. To edit an existing table, double click on it to produce the dialog box below. To create a new table, click the Sigma button in the Layout editor's tool palette. Drag a rectangle in the area where you want your statistical table to appear. The following dialog opens within which you can construct your table.
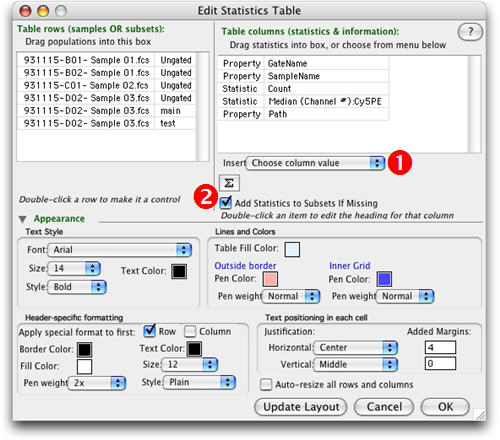
Drag-and-drop samples or subpopulations from the Workspace into the upper left box. This list will label the rows of your new table. Drag-and-drop statistics or other information into the upper right box. These will label the columns of your table. When you click the Update Layout button, your table will appear in the Layout editor with the calculations in place.
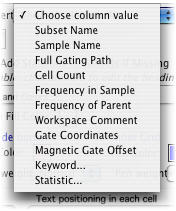
Use the Choose Column Value (Number One above) drop-down list to add columns that don't appear in the current layout. Possible values are shown at right.
Click the Sigma button (Number Two above) to add a new statistic just as you might do in the Workspace. Use the checkbox Add Statistics to Subsets If Missing (also next to the Two) to tell FlowJo to calculate the statistical values for populations in the new table that have not yet been calculated in the Workspace.
Opening the disclosure triangle labeled Appearance shows the usual tools for controlling the style of the text and boxes in the new table.
Click Update Layout to view your changes in the Layout Editor, click OK to accept the current choices and close the Edit Statistics Table dialog box.