
The Layout Editor Gate Statistics Legend
The Layout Gate Statistics Legend allows for the assignment of multiple statistics, or keywords, per gate level on plots in the Layout Editor, nicely organized in a tabular form. Like all layout objects, the statistics table can be batched across a data set or experiment.
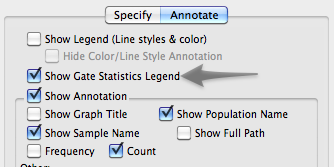
To enable the table object, double click on a plot in the Layout Editor, select the Annotate tab in the Graph Definition Window and then check the Show Gate Statistics Legend checkbox.
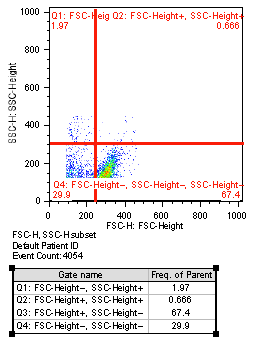
When you return to your layout you will see the legend. By default, the legend will appear with just the Gate Name and Frequency of Parent columns and will be populated with gate level information for those columns. The Statistics Legend updates live, so any additional gates created on a population will update in the Statistics Legend for a plot in the Layout Editor.
Double-click on the Statistics Legend to open the legend options.
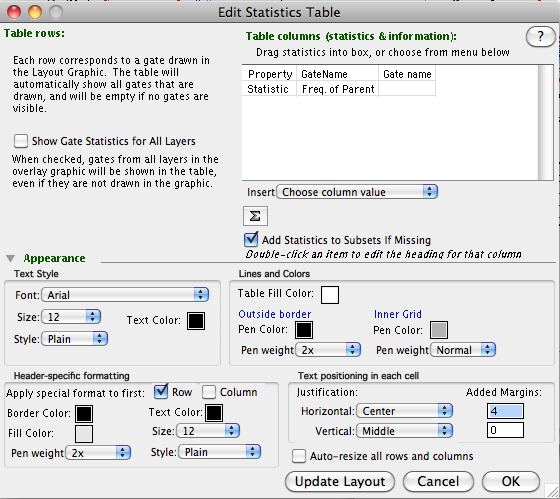
Form the Statistics Legend dialog, you can add additional statistics from the Workspace via drag-and-drop to the Table Columns area of the dialog (upper right area), as well as choose additional keywords to display, or formatting options.
Once the Statistics Legend has been formatted to your liking, you can batch the plot(s) across datasets, and a legend will be generated for each plot.